SUMIFS for Financial AnalysisThe Complete Guide for Accountants and Finance Professionals
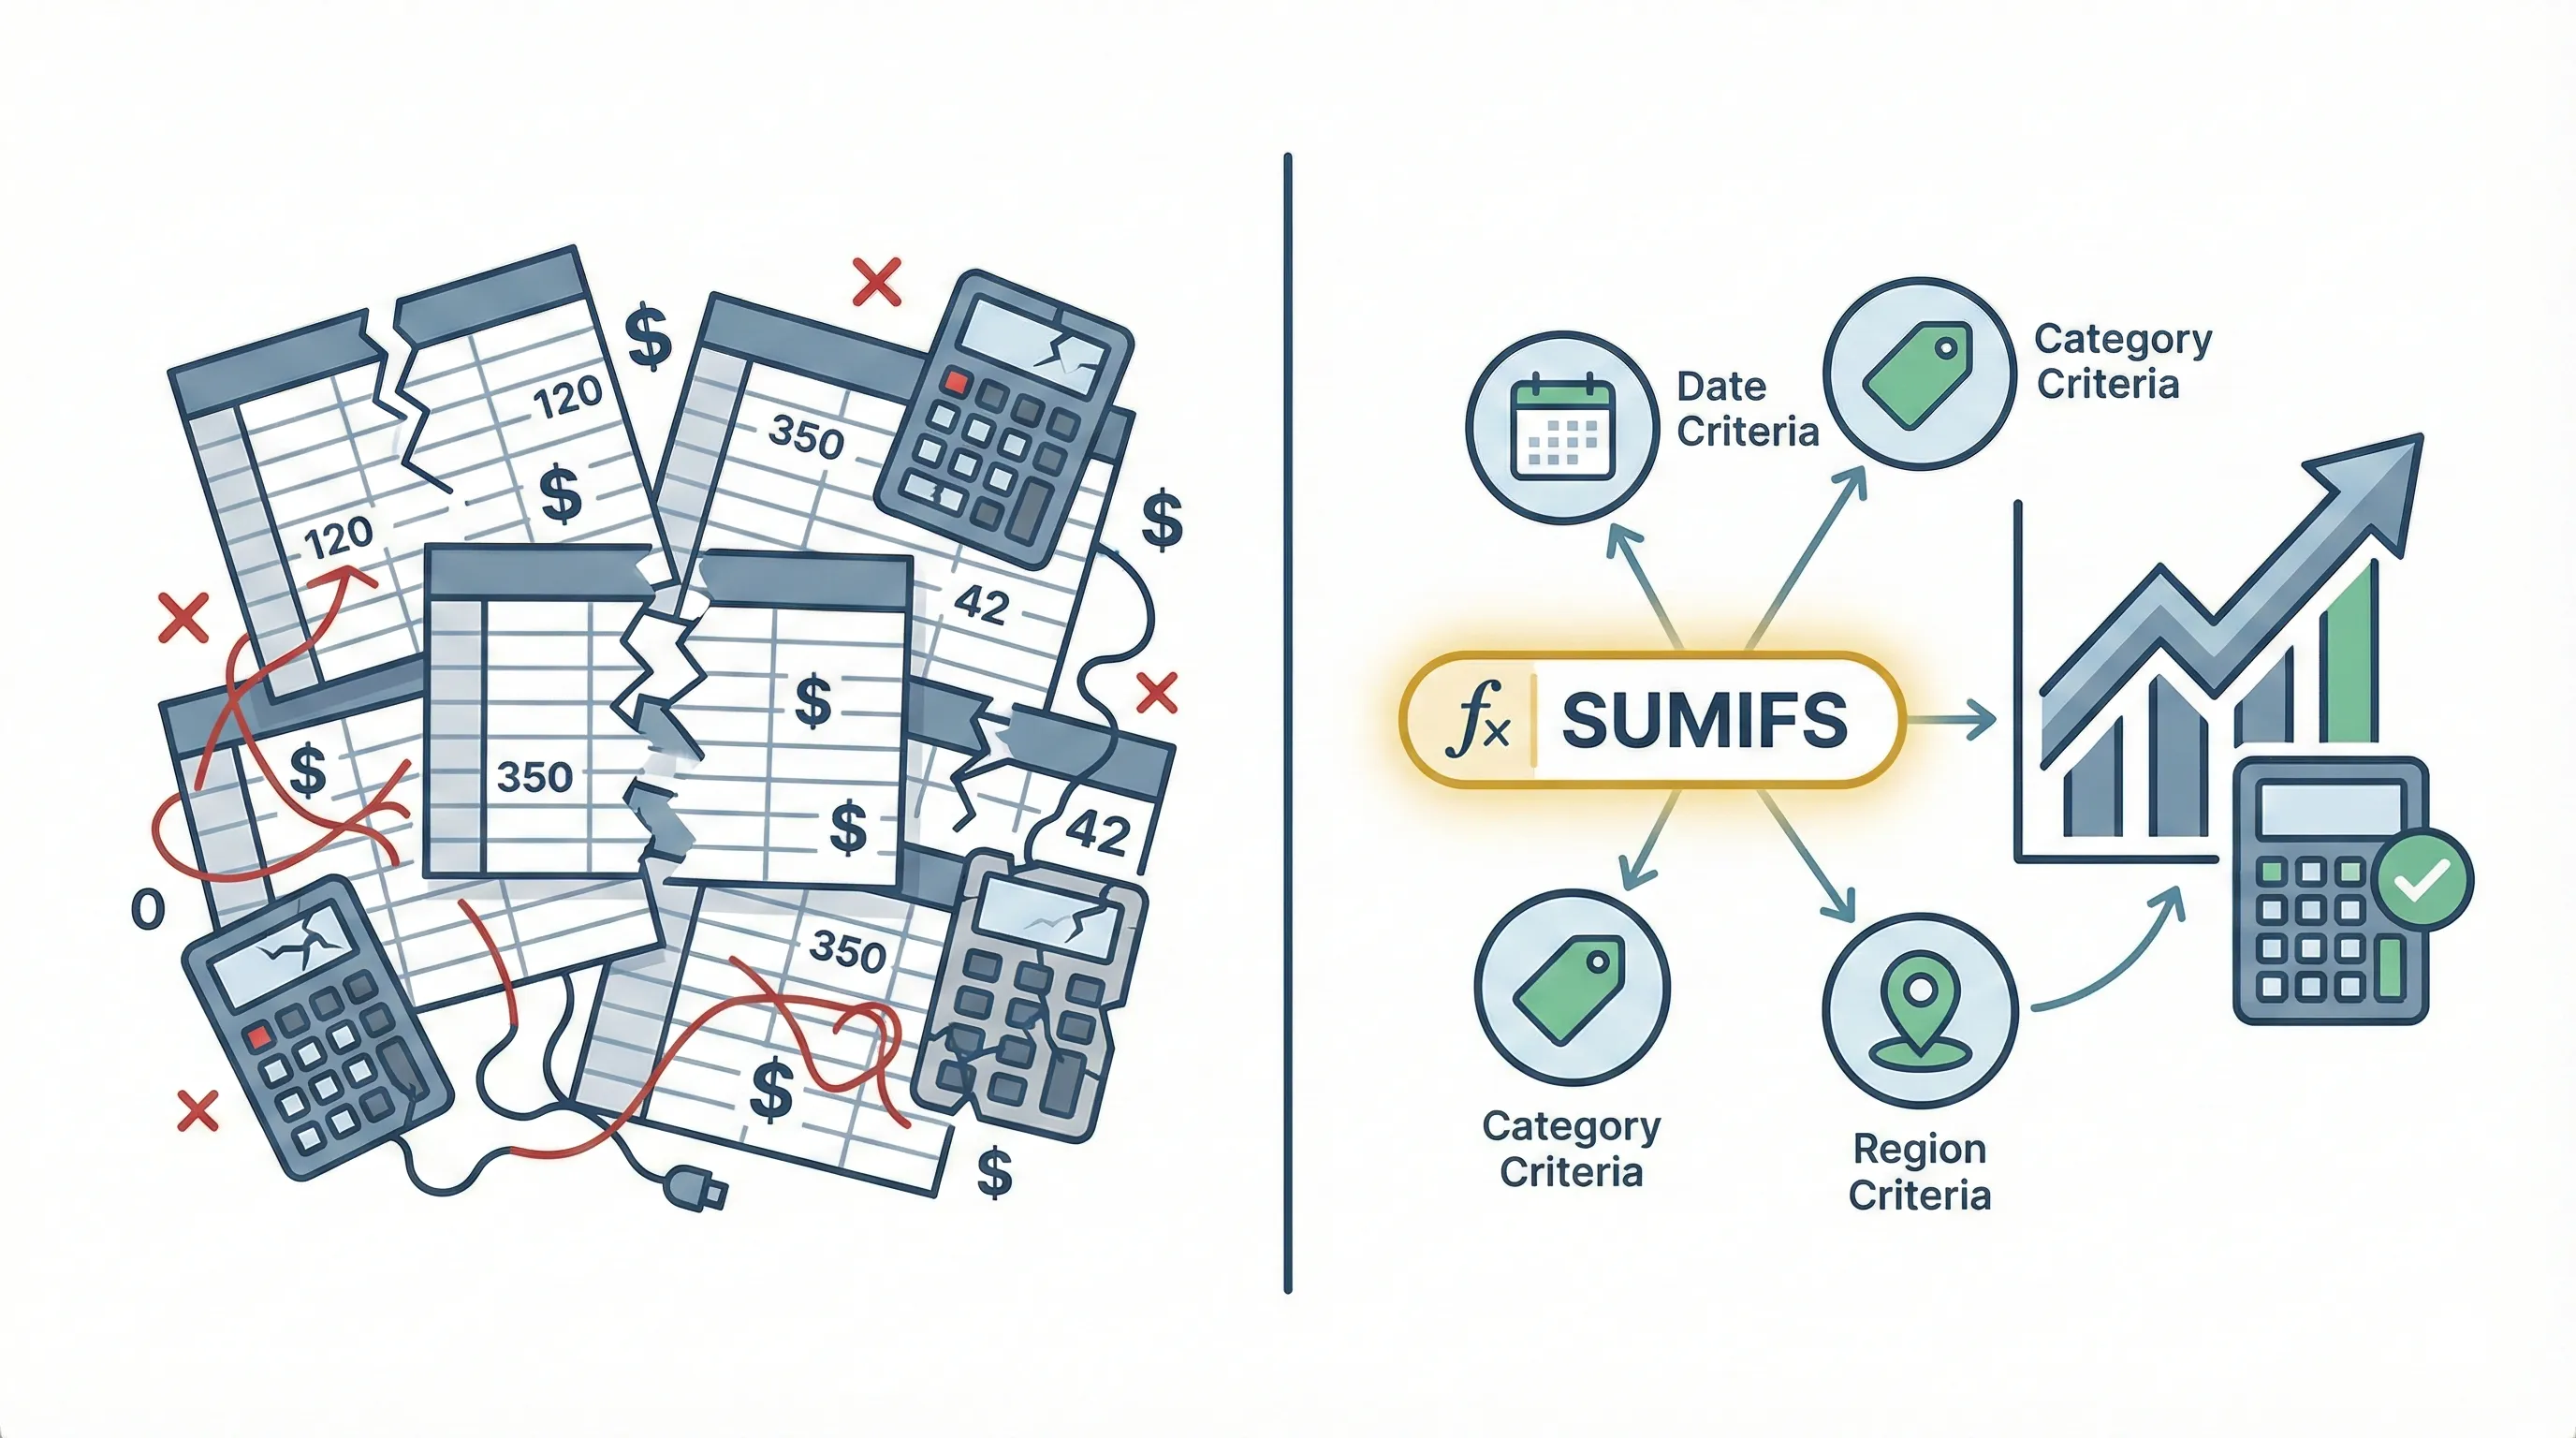
Let's be honest: financial reporting can get messy fast. You've got departments, accounts, periods, regions, all intersecting in ways that make simple sums useless. SUMIFS is the answer - it's where financial reporting actually gets powerful.
What is SUMIFS and Why It Matters for Finance
SUMIFS is an Excel function that sums values in a specified range based on multiple criteria. Unlike its predecessor SUMIF - which handles only one condition - SUMIFS allows you to apply numerous conditions simultaneously, making it ideal for complex financial analysis scenarios.
🎯Why This Matters
Mastering SUMIFS can reduce your reporting time by 70%. One client cut their month-end close from 3 days to 6 hours using the techniques in this guide, combined with Power Query automation.
SUMIFS Syntax and Structure
The SUMIFS formula follows this structure:
Parameters explained:
- sum_range: The range of cells you want to sum (expense amounts, revenue figures)
- criteria_range1: The first range to evaluate against your first criterion
- criteria1: The condition that must be met in criteria_range1
- criteria_range2, criteria2: Additional range-criteria pairs (you can add up to 127 criteria pairs)
⚠️ Key difference from SUMIF
In SUMIF, the sum_range comes last. In SUMIFS, it comes first. This syntax difference is crucial to remember when building formulas. Tripped me up constantly at first.
Why SUMIFS is Essential for Financial Analysis
Financial data rarely exists in simple, single-dimension formats. Accountants and analysts constantly need to answer questions like:
- What were total sales for Product A in the Northeast region during Q4?
- How much did the Marketing department spend on consulting services in 2025?
- What's the total accounts receivable balance for customers with credit terms of Net 30 in the Technology industry?
SUMIFS handles these multi-dimensional questions elegantly in a single formula, eliminating the need for complex helper columns, multiple intermediate calculations, or time-consuming manual filtering.
Practical Financial Analysis Applications
Let's explore real scenarios where SUMIFS transforms financial analysis efficiency and accuracy.
Budget vs. Actual Variance Analysis
Budget variance analysis is a cornerstone of financial management. SUMIFS excels at aggregating actual expenses by department, account, and period for comparison against budget.
Scenario: You need to calculate total actual expenses for the Marketing department's Advertising account in Q1 2026.
Data Structure:
- Column A: Department
- Column B: Account Code
- Column C: Month
- Column D: Actual Amount
This formula sums all amounts in column D where the department is Marketing, the account code is 5100-Advertising, and the date falls within Q1 2026.
Advanced Application: Create a dynamic variance report by combining SUMIFS for actuals with a similar formula for budget, then calculating the difference:
Revenue Recognition by Product and Region
For companies with multiple product lines and geographic regions, SUMIFS provides granular revenue analysis essential for strategic decision-making.
Scenario: Calculate total revenue for Product Line B in the Western region for customers with annual contracts.
Business Value: This analysis helps identify which product-region combinations drive the most revenue, informing resource allocation, sales territory planning, and product development priorities. One of my clients discovered Product B in the Western region was driving 40% of annual contract revenue - game-changing insight from a simple formula.
Accounts Receivable Aging Analysis
AR aging reports require summing outstanding balances based on invoice age brackets, customer segments, and payment terms - perfect SUMIFS territory.
Scenario: Calculate total receivables that are 31-60 days overdue for commercial customers.
Enhanced Analysis: Build a complete aging schedule using multiple SUMIFS formulas for different day ranges (0-30, 31-60, 61-90, 90+), providing comprehensive visibility into collection risk.
Departmental Expense Analysis
Finance teams regularly analyze spending patterns by department, expense category, and vendor to identify cost-saving opportunities and ensure budget compliance.
Scenario: Calculate total consulting expenses for the IT department from vendors classified as "Preferred."
Strategic Insight: This analysis reveals whether preferred vendor programs deliver expected savings and helps negotiate better terms based on actual spending patterns. Another client realized their preferred vendor program was delivering exactly zero in expected savings - they renegotiated within a month.
Multi-Entity Consolidation
Organizations with multiple legal entities or business units need to consolidate financial results while maintaining the ability to analyze individual entity performance.
Scenario: Sum revenue for all entities in the European region, excluding intercompany transactions.
The "<>" operator means "not equal to," excluding intercompany transactions from the consolidation.
Advanced SUMIFS Techniques for Finance Professionals
Beyond basic applications, combining SUMIFS with other Excel capabilities creates powerful analytical tools.
⚡Advanced Tip
Once you master SUMIFS, level up with DAX measures in Power BI for even more powerful financial modeling. The concepts transfer directly - if you understand SUMIFS, you're halfway to mastering DAX.
Using Wildcards for Flexible Criteria
Wildcards enable pattern matching when exact criteria aren't practical or when you need to aggregate related categories.
Scenario: Sum all expenses for accounts starting with "6" (typically operating expenses in many chart of accounts structures).
The asterisk (*) wildcard matches any characters after "6," capturing accounts 6000, 6100, 6200, etc.
Question mark wildcard: Use "?" to match a single character. For example, "510?" matches 5100, 5101, 5102, but not 51000.
Combining SUMIFS with Date Functions
Financial analysis frequently requires period-based aggregations. Combining SUMIFS with date functions creates dynamic formulas that automatically adjust for current periods.
Scenario: Calculate month-to-date expenses that automatically updates as new transactions are recorded.
This formula sums expenses from the first day of the current month through today, automatically adjusting each day.
Year-to-date calculation:
SUMIFS with Cell References for Dynamic Reports
Hard-coding criteria limits flexibility. Using cell references creates dynamic reports that users can easily modify without editing formulas.
Formula structure:
Users enter desired department in G2, account in G3, and period in G4. The formula automatically recalculates based on these inputs, creating an interactive analysis tool.
Nested SUMIFS for Complex Scenarios
Some analyses require summing SUMIFS results themselves, creating multi-layered aggregations.
Scenario: Calculate total expenses for multiple departments (Marketing, Sales, and Customer Service) for a specific account.
SUMIFS(Expenses, Department, "Sales", Account, A2) +
SUMIFS(Expenses, Department, "Customer Service", Account, A2)
Alternative using SUMPRODUCT: For more elegant handling of multiple criteria values:
=SUMPRODUCT(SUMIFS(Expenses, Department, {"Marketing","Sales","Customer Service"}, Account, A2))SUMIFS with Calculated Criteria
Criteria don't have to be static values - they can be calculations or references to other formulas.
Scenario: Sum revenue for transactions exceeding the average transaction size.
This dynamically adjusts as your dataset changes, always summing transactions above the current average.
SUMIFS vs. Alternatives: When to Use Each
Understanding when SUMIFS is the optimal choice versus alternatives helps you build more efficient financial models.
SUMIFS vs. SUMIF
Use SUMIF when: You have only one criterion. SUMIF is slightly simpler and marginally faster for single-condition scenarios.
Use SUMIFS when: You have multiple criteria. Even if you currently have one criterion but might add more later, starting with SUMIFS provides easier scalability.
SUMIFS vs. Pivot Tables
Pivot tables offer powerful data summarization capabilities, but they're not always the best choice for financial analysis.
Use Pivot Tables when:
- You need interactive exploration of data from multiple angles
- You're creating ad-hoc analysis for one-time questions
- You want to quickly visualize data patterns
- Your audience prefers interactive reports
Use SUMIFS when:
- You need formulas that automatically update as source data changes
- You're building structured financial reports with specific layouts
- You need to combine aggregated results with other calculations
- You require precise control over formatting and presentation
- You're creating templates that others will use repeatedly
Many finance professionals prefer SUMIFS for formal reporting because formulas provide transparency, auditability, and precise control that pivot tables sometimes lack.
SUMIFS vs. SUMPRODUCT
SUMPRODUCT offers incredible flexibility for complex calculations but with different syntax and performance characteristics.
Use SUMIFS when:
- Your criteria are straightforward comparisons (equals, greater than, less than)
- You're working with very large datasets where performance matters
- You want formulas that are easier for colleagues to understand and maintain
Use SUMPRODUCT when:
- You need to perform calculations on the values before summing
- You require complex logical conditions that SUMIFS can't handle
- You need to work with arrays in ways SUMIFS doesn't support
Example where SUMPRODUCT is necessary:
This multiplies Units by Price before summing - something SUMIFS can't do directly.
Common SUMIFS Errors and Troubleshooting
Even experienced analysts encounter SUMIFS challenges. Understanding common errors accelerates troubleshooting.
🚨Common Pitfall
The #1 mistake? Forgetting that SUMIFS and SUMIF have different argument orders. In SUMIF, sum_range comes last. In SUMIFS, it comes first. Always double-check your syntax! For the official function reference, see Microsoft's SUMIFS documentation.
VALUE! Error
Cause: Criteria ranges are different sizes than the sum range.
Solution: Ensure all ranges have the same number of rows. If your sum_range is D2:D1000, all criteria ranges must also span rows 2-1000.
Verification formula:
Zero Results When Data Exists
Cause 1: Data type mismatch. Numbers stored as text won't match numeric criteria.
Solution: Convert text to numbers using VALUE function or multiply by 1:
Cause 2: Extra spaces in data or criteria.
Solution: Use TRIM function to remove spaces:
Cause 3: Date formatting inconsistencies.
Solution: Ensure dates are stored as actual date values, not text. Use DATEVALUE if necessary.
Incorrect Results with Text Criteria
Cause: Forgetting quotation marks around text criteria or incorrect use of comparison operators.
Correct syntax:
=SUMIFS(Amounts, Department, Marketing) 'Incorrect - Excel looks for a named range
For cell references, don't use quotes:
Performance Issues with Large Datasets
Cause: SUMIFS recalculates whenever any cell in the workbook changes, which can slow down large models.
Solutions:
- Convert data ranges to Excel Tables for more efficient calculation
- Use manual calculation mode (Formulas > Calculation Options > Manual) for very large models
- Consider using helper columns to pre-calculate complex criteria
- Limit the range to actual data rather than entire columns (use D2:D10000 instead of D:D)
Best Practices for Financial Reporting with SUMIFS
Implementing these practices ensures your SUMIFS formulas remain accurate, maintainable, and audit-friendly.
Use Named Ranges for Clarity
Named ranges make your formulas self-documenting and much easier to audit. Combined with XLOOKUP for data retrieval, you can build powerful financial models that are both readable and maintainable.
Instead of:
Use:
Named ranges make formulas self-documenting and easier to audit.
Structure Data Properly
SUMIFS works best with properly structured data:
- One row per transaction or data point
- Consistent column headers
- No merged cells
- No blank rows within the data
- Consistent data types within each column
Build Validation Checks
Create reconciliation formulas to verify SUMIFS accuracy:
This ensures your categorized sums equal the total, catching errors in criteria or data structure.
Document Complex Formulas
Add comments to cells containing complex SUMIFS formulas explaining:
- What the formula calculates
- Any assumptions or business rules applied
- Date ranges or periods covered
- Known limitations or edge cases
Standardize Criteria Formatting
Establish organizational standards for how criteria are formatted:
- Date formats (YYYY-MM-DD vs. MM/DD/YYYY)
- Text case (uppercase, lowercase, or title case)
- Number formats (with or without thousand separators)
Consistency prevents matching failures and reduces errors.
Building a Dynamic Financial Dashboard with SUMIFS
SUMIFS formulas form the foundation of powerful, interactive financial dashboards that provide real-time insights.
Dashboard Structure
Input Section: Create cells where users select:
- Department (data validation dropdown)
- Time period (month, quarter, year)
- Account category
- Any other relevant dimensions
Calculation Section: Use SUMIFS formulas referencing the input cells:
Visualization Section: Create charts and conditional formatting that automatically update based on SUMIFS results.
Key Performance Indicators (KPIs)
Use SUMIFS to calculate critical financial metrics:
Gross Margin:
Operating Expense Ratio:
Department Budget Utilization:
💡Pro Tip
Combine SUMIFS with Power Query for even more powerful financial reporting. Use Power Query to clean and transform your data, then SUMIFS for dynamic calculations and analysis.
Frequently Asked Questions About SUMIFS
What's the difference between SUMIF and SUMIFS?▼
Can SUMIFS handle date ranges and wildcards?▼
Why is my SUMIFS formula returning 0 or #VALUE!?
Should I use SUMIFS or Pivot Tables for financial reporting?
How can I make my SUMIFS formulas faster on large datasets?
Where can I learn more about Excel functions for financial analysis?
Key Takeaways
SUMIFS handles multiple criteria - up to 127 pairs. Unlike SUMIF, it puts the sum_range first, making it perfect for complex financial analysis.
Combine with dynamic formulas - use TODAY(), DATE(), and cell references to create reports that update automatically.
Use named ranges - make formulas readable and auditable. =SUMIFS(Expenses, Dept, "Marketing") beats cryptic cell references.
Build validation checks - ensure your categorized sums equal the total. Catch errors before they reach your CFO.
SUMIFS is where financial reporting gets powerful. This single function handles the vast majority of conditional aggregation needs - from simple budget variance reports to complex multi-dimensional revenue analysis.
The key to mastery isn't just syntax - it's knowing when and how to apply SUMIFS to solve real business problems. Combined with named ranges, data validation, and dynamic formulas, you create financial models that are both powerful and maintainable.
"The most valuable financial models deliver accurate results while remaining accessible to your entire finance team."
Ready to Level Up Your Financial Analysis?
SUMIFS is just one piece of the Excel puzzle. Master the full toolkit and transform how you report.