Downloads
Premium Templates

Cash Flow Forecast Model
A Unique Excel Financial Model for startup and existing businesses - forecast business growth and Cash flow with a complete 3-statement model.

PRO Depreciation Excel Template
Simplify depreciation calculation using Straight Line method. Save time in fixed assets management with our ready-to-use toolkit.

Compare Data in Excel VBA Template
Automatically find newly added rows, deleted rows, and cell-level variances between two datasets. Handles thousands of rows in seconds.

Prepaid Expenditure Tracker Template
Automate prepaid expense tracking, amortization calculation, and reconciliation. Features dynamic opening balances and multi-year tracking.

Prepaid Amortization Schedule Excel V3
Daily-rate amortization engine for unlimited prepaid contracts. Handles terminations, refunds, GL mapping, and Power Query automation.
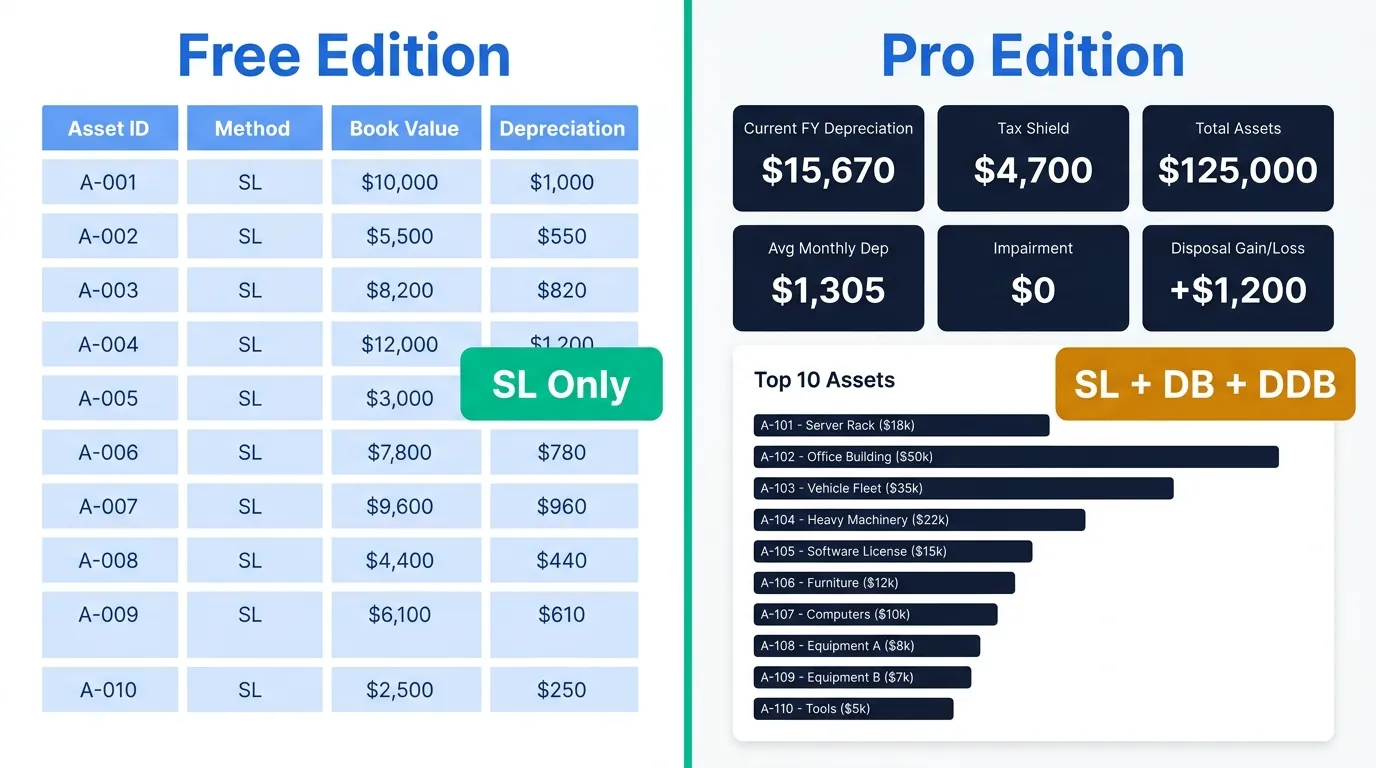
Fixed Asset Depreciation Calculator Excel
Free + Pro Excel calculator for SL, DB, and DDB depreciation. 50 assets, validation engine, live KPI dashboard, and Power Query report. Built by a GCC CFO. Audit-ready.
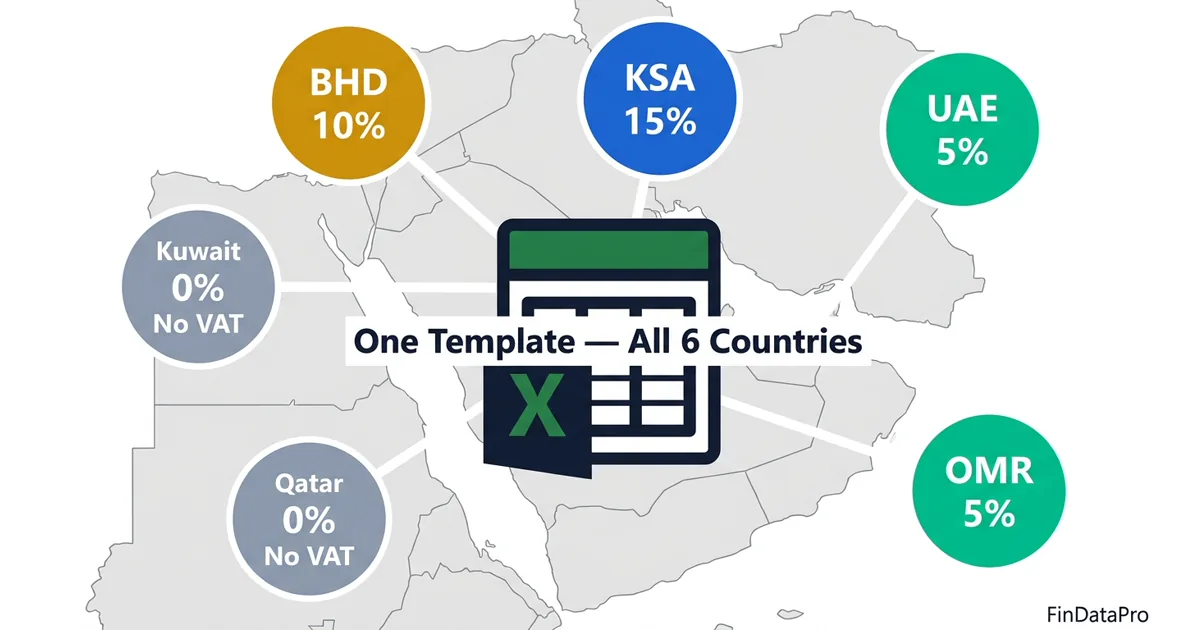
GCC VAT-Ready Bookkeeping Template
The only GCC bookkeeping template that auto-applies correct VAT rates across all 6 countries. UAE 5%, KSA 15%, Bahrain 10%, Oman 5%. Live KPI dashboard, compliance flags, and multi-currency consolidation in one Excel file.
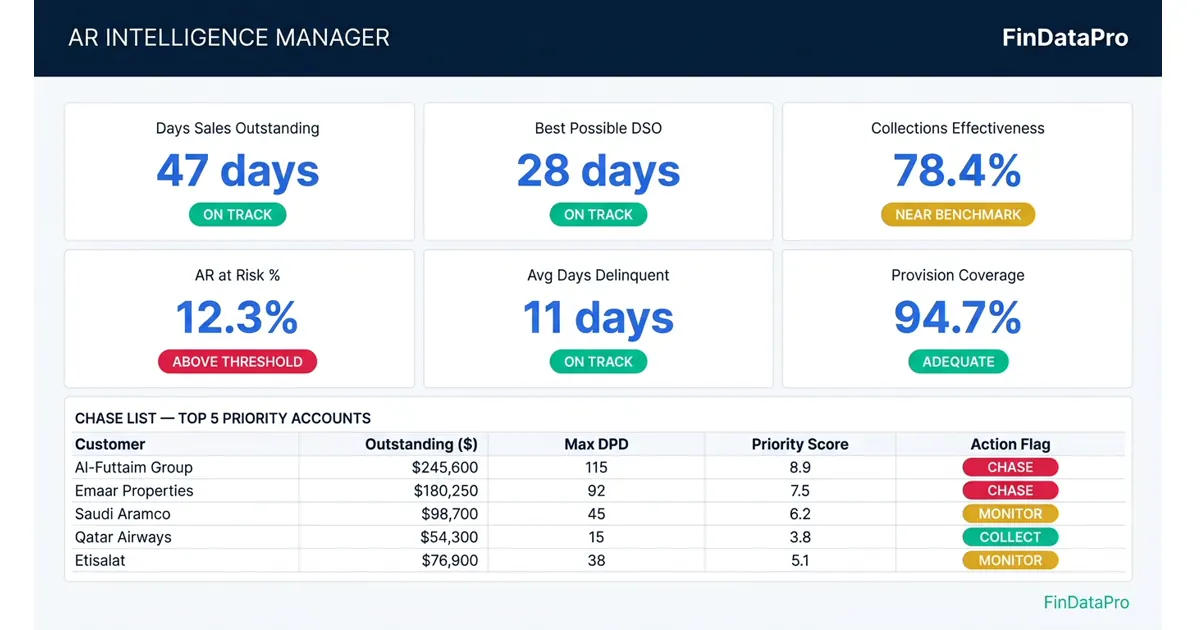
AR Intelligence Manager
IFRS 9-compliant accounts receivable Excel template with automated Chase List, ECL provisioning, six-month cash forecast, and AI-generated management commentary. Built for GCC B2B finance teams. Standard ($49.99) and Power Query ($59.99) editions.
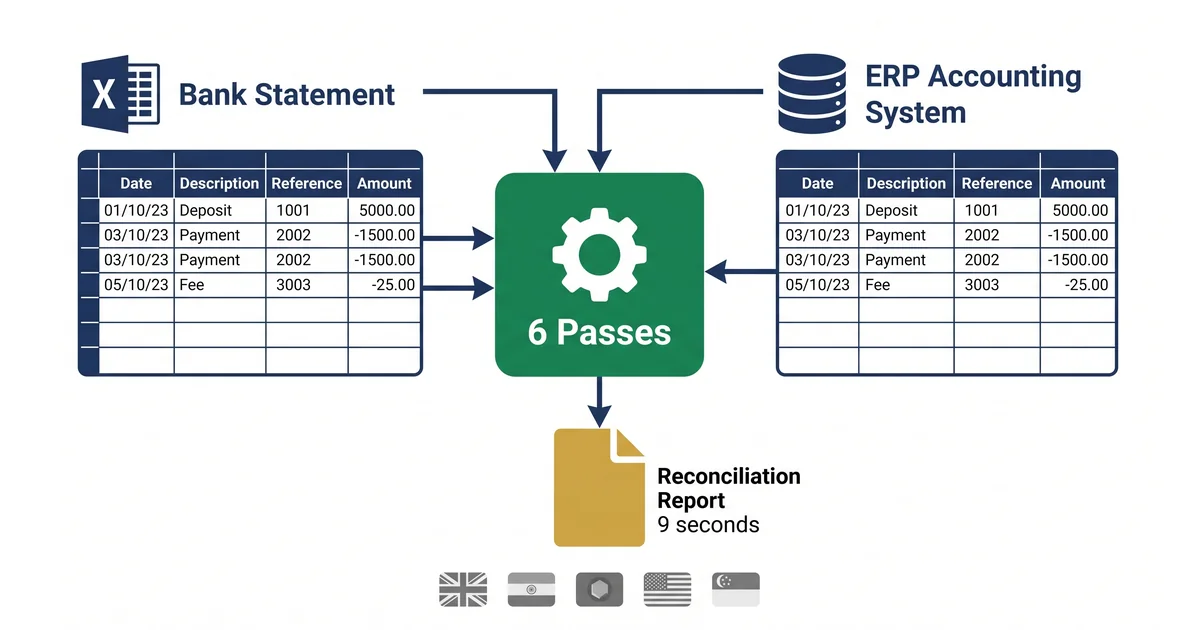
FinDataPro AutoBankRec v2.0
Reconcile 500 bank transactions in under 10 seconds inside Claude Cowork. Six-pass matching engine handles exact, fuzzy, many-to-one, and timing differences. Covers India (NEFT, UPI, TDS), GCC (WPS, FAWRI+, SWIFT), UK, Europe, and Americas. No coding required.

Finance Fraud Prevention Checklist 2026
The CFO playbook for 2026 fraud threats: AI deepfakes, BEC, COSO controls, and real-time data gaps. Six control areas with RAG scoring methodology. Covers both traditional fraud vectors and AI-enabled attack patterns.
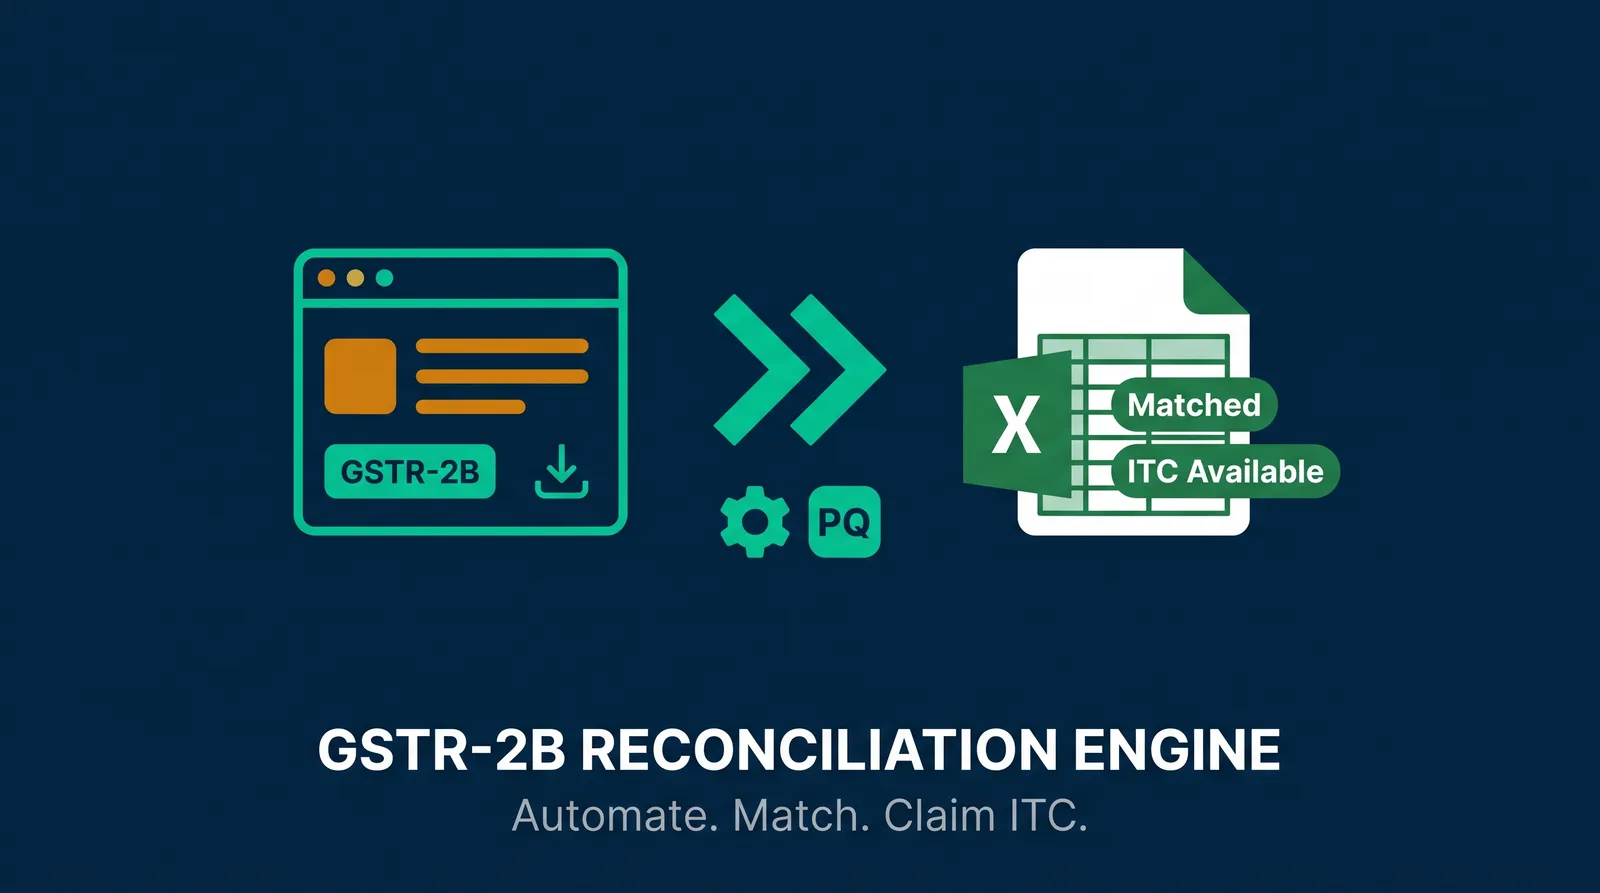
GSTR-2B Reconciliation Engine
3-pass matching engine for GSTR-2B reconciliation. Handles Tally, Zoho, SAP, IMS rejected invoices, and 7 ITC statuses in Excel + Power Query.
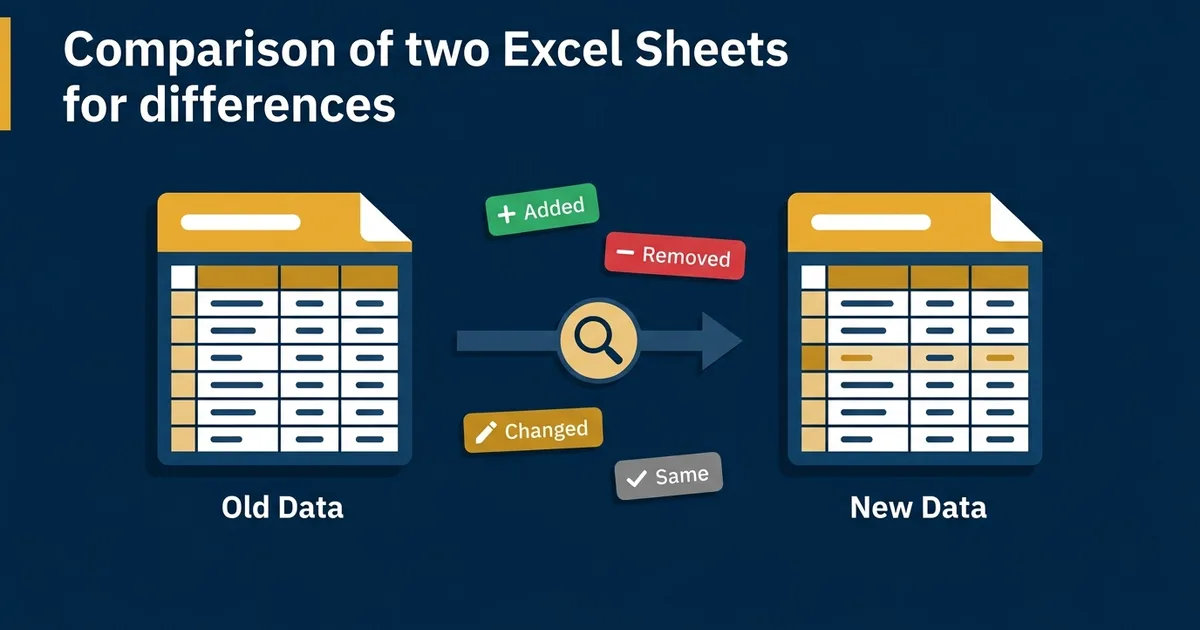
ExceptionGuard: Compare Two Excel Sheets
Key-based row and cell-level comparison engine. Free 24-row edition or Enterprise with unlimited rows (500k+) and a full Audit Log.