The DAX 80/20 RuleMaster 20% of Functions and Solve 80% of Your Power BI Problems
Why Most Beginners Learn DAX Wrong
There are over 250 DAX functions in the Microsoft documentation. Beginners open the function reference, see 250+ functions, and immediately panic or try to learn everything at once. Both responses are wrong.
The 80/20 principle (Pareto Principle) applies to DAX exactly as it applies to any complex domain: roughly 20% of inputs produce 80% of results. In real-world Power BI reports, approximately 15 to 20 functions and two core concepts cover 80%+ of what most BI analysts and finance professionals need to build every day.
This post delivers a curated, ordered learning path for someone starting DAX in 2026. The exact 20% you need, explained clearly, with examples that use real business scenarios: Sales, Finance, HR use cases. By the end of this post, you will know which functions to learn first, in what order, and why that order matters. You will be able to build year-to-date revenue measures, percentage-of-total calculations, and dynamic ranking tables without memorising 250 functions.

ACA | FMVA® | 19 Years in Finance
Before You Write a Single Formula, Understand These Two Things
DAX's learning curve is not about memorising syntax. It is about understanding two foundational concepts that every single DAX formula relies on. Get these wrong and no function will behave the way you expect.
Concept 1: Filter Context
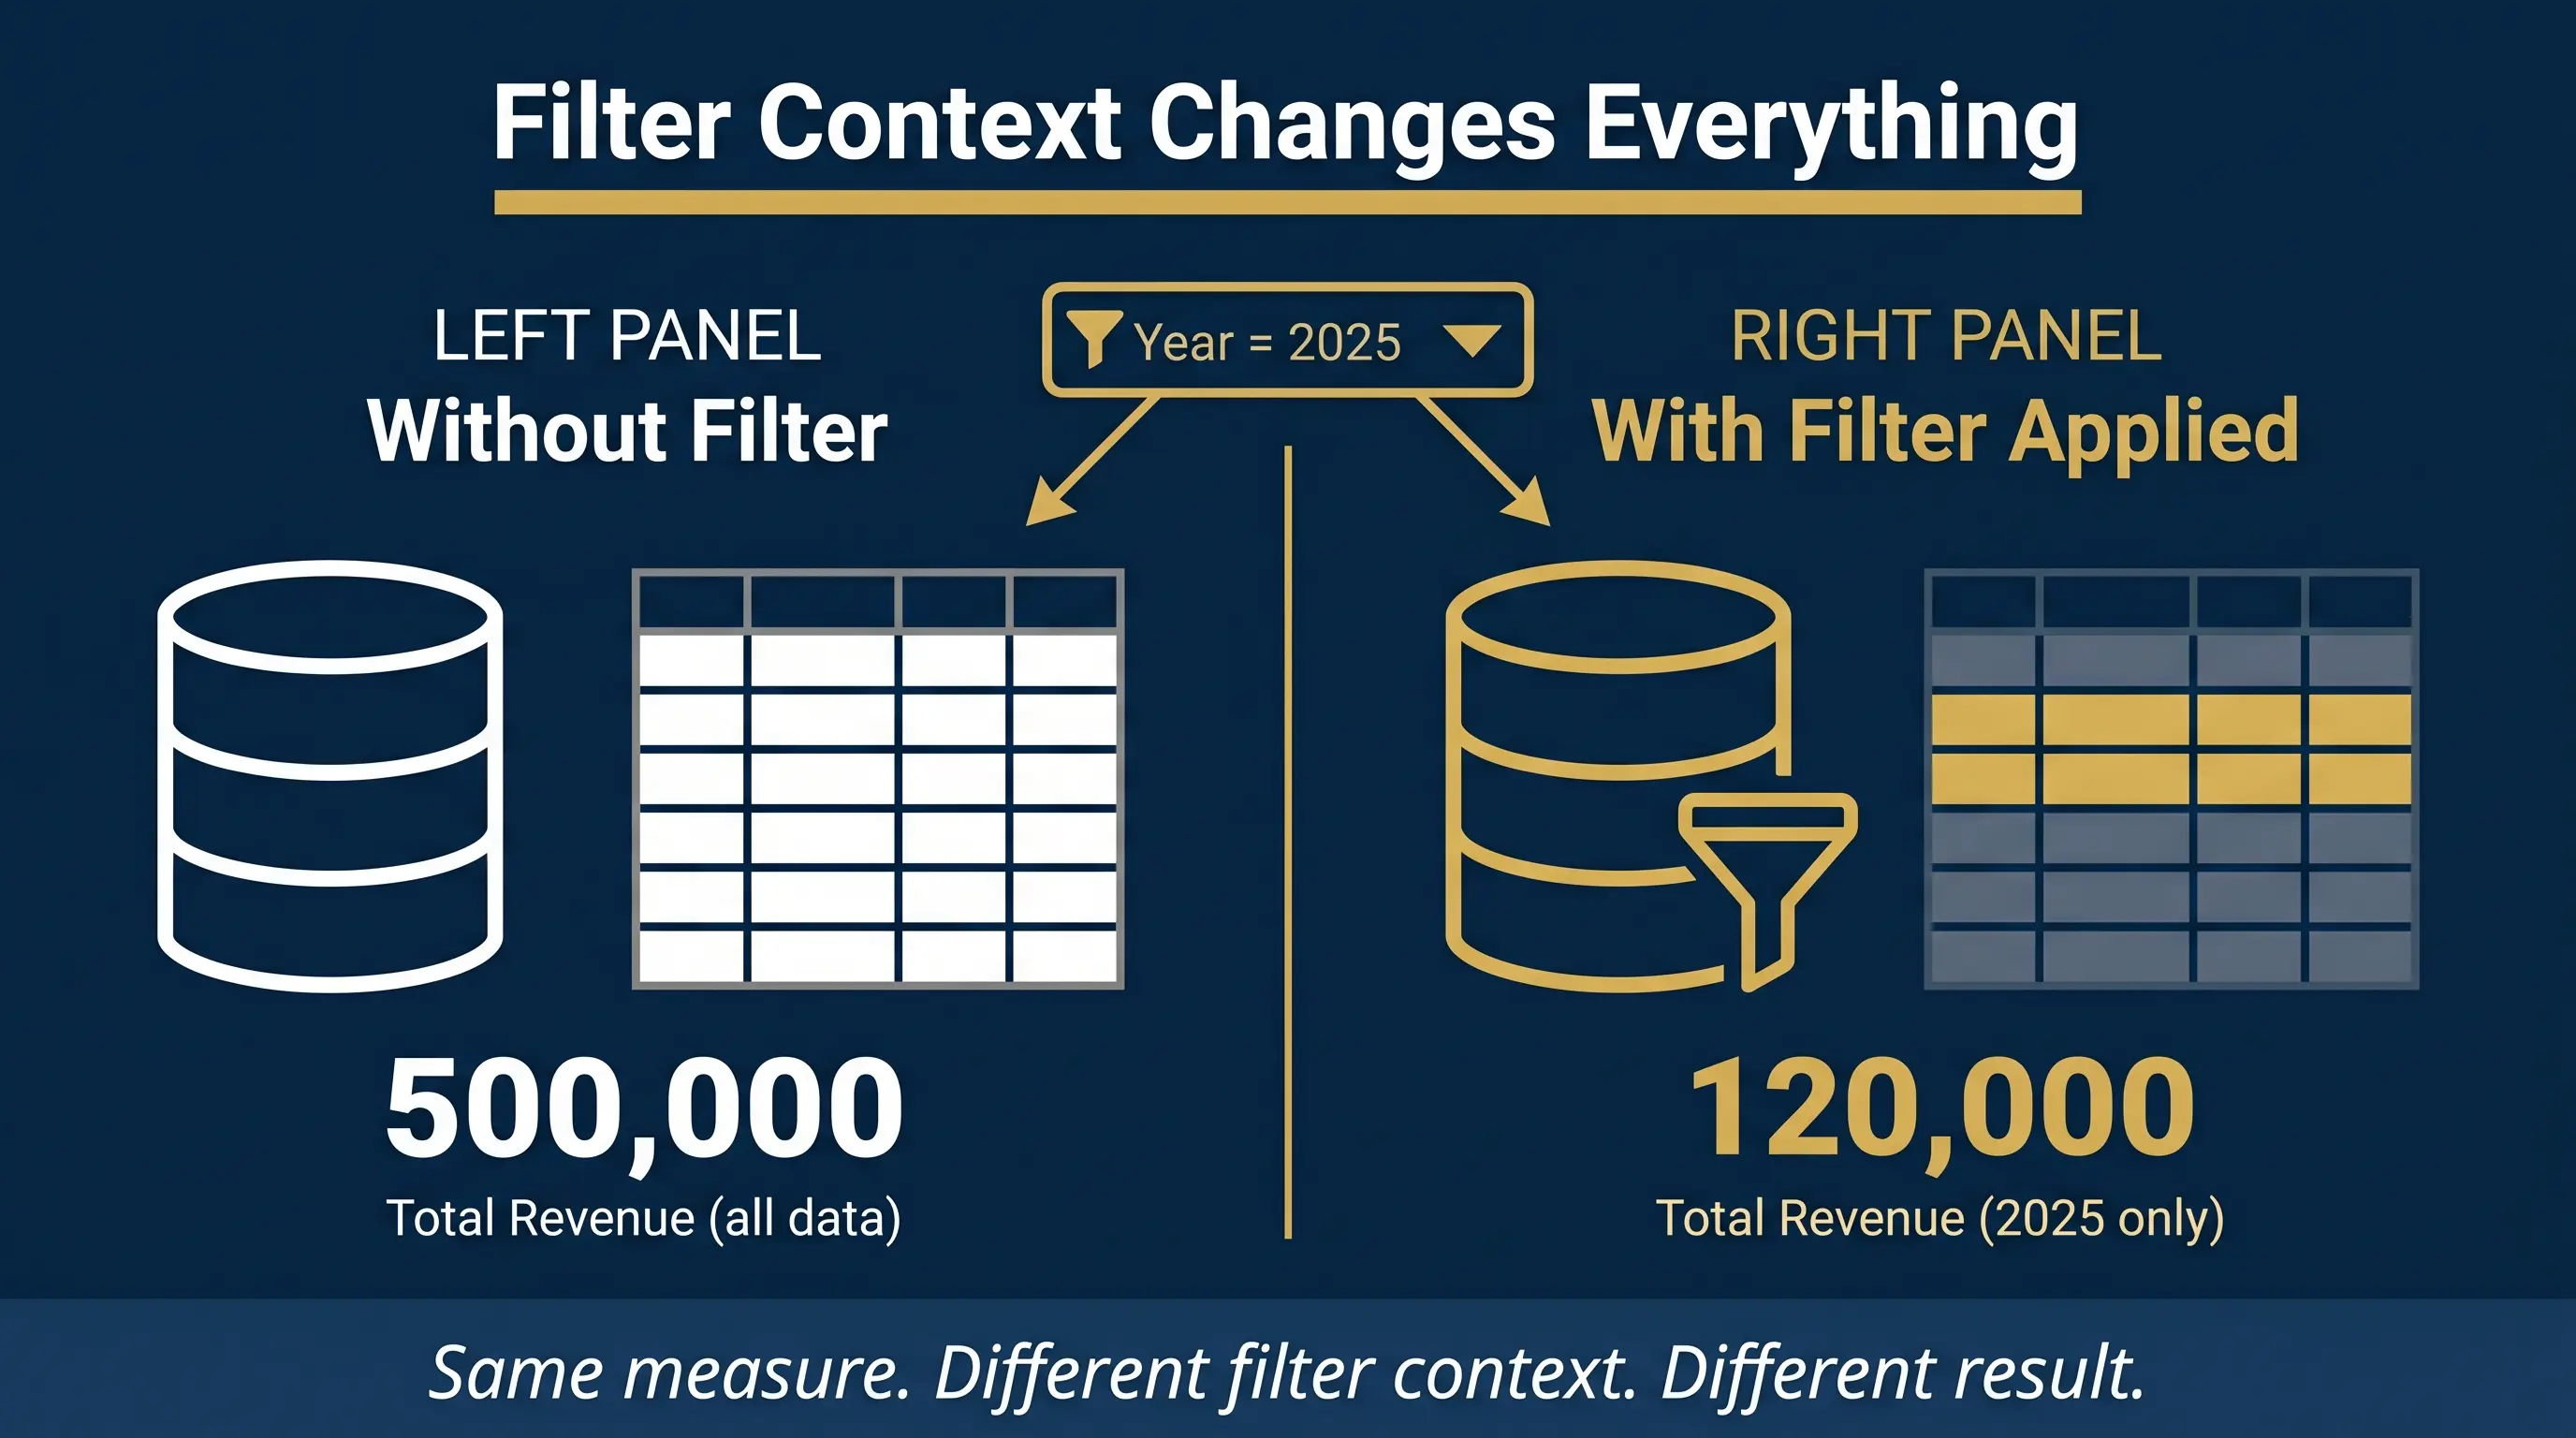
Filter context is the set of conditions DAX uses to decide which rows of data to include in a calculation. When a user selects “2025” in a slicer, DAX automatically applies a filter that restricts all calculations to 2025 data only. Every measure in Power BI is already aware of the filter context applied to the visual it lives in.
This is what makes DAX dynamic. The same measure returns different results in different cells of a matrix, because the filter context is different in each cell. A measure called Total Sales returns 500,000 in one row and 120,000 in another row — not because the formula changed, but because the filter context changed.
Concept 2: Measures vs Calculated Columns
| Feature | Measure | Calculated Column |
|---|---|---|
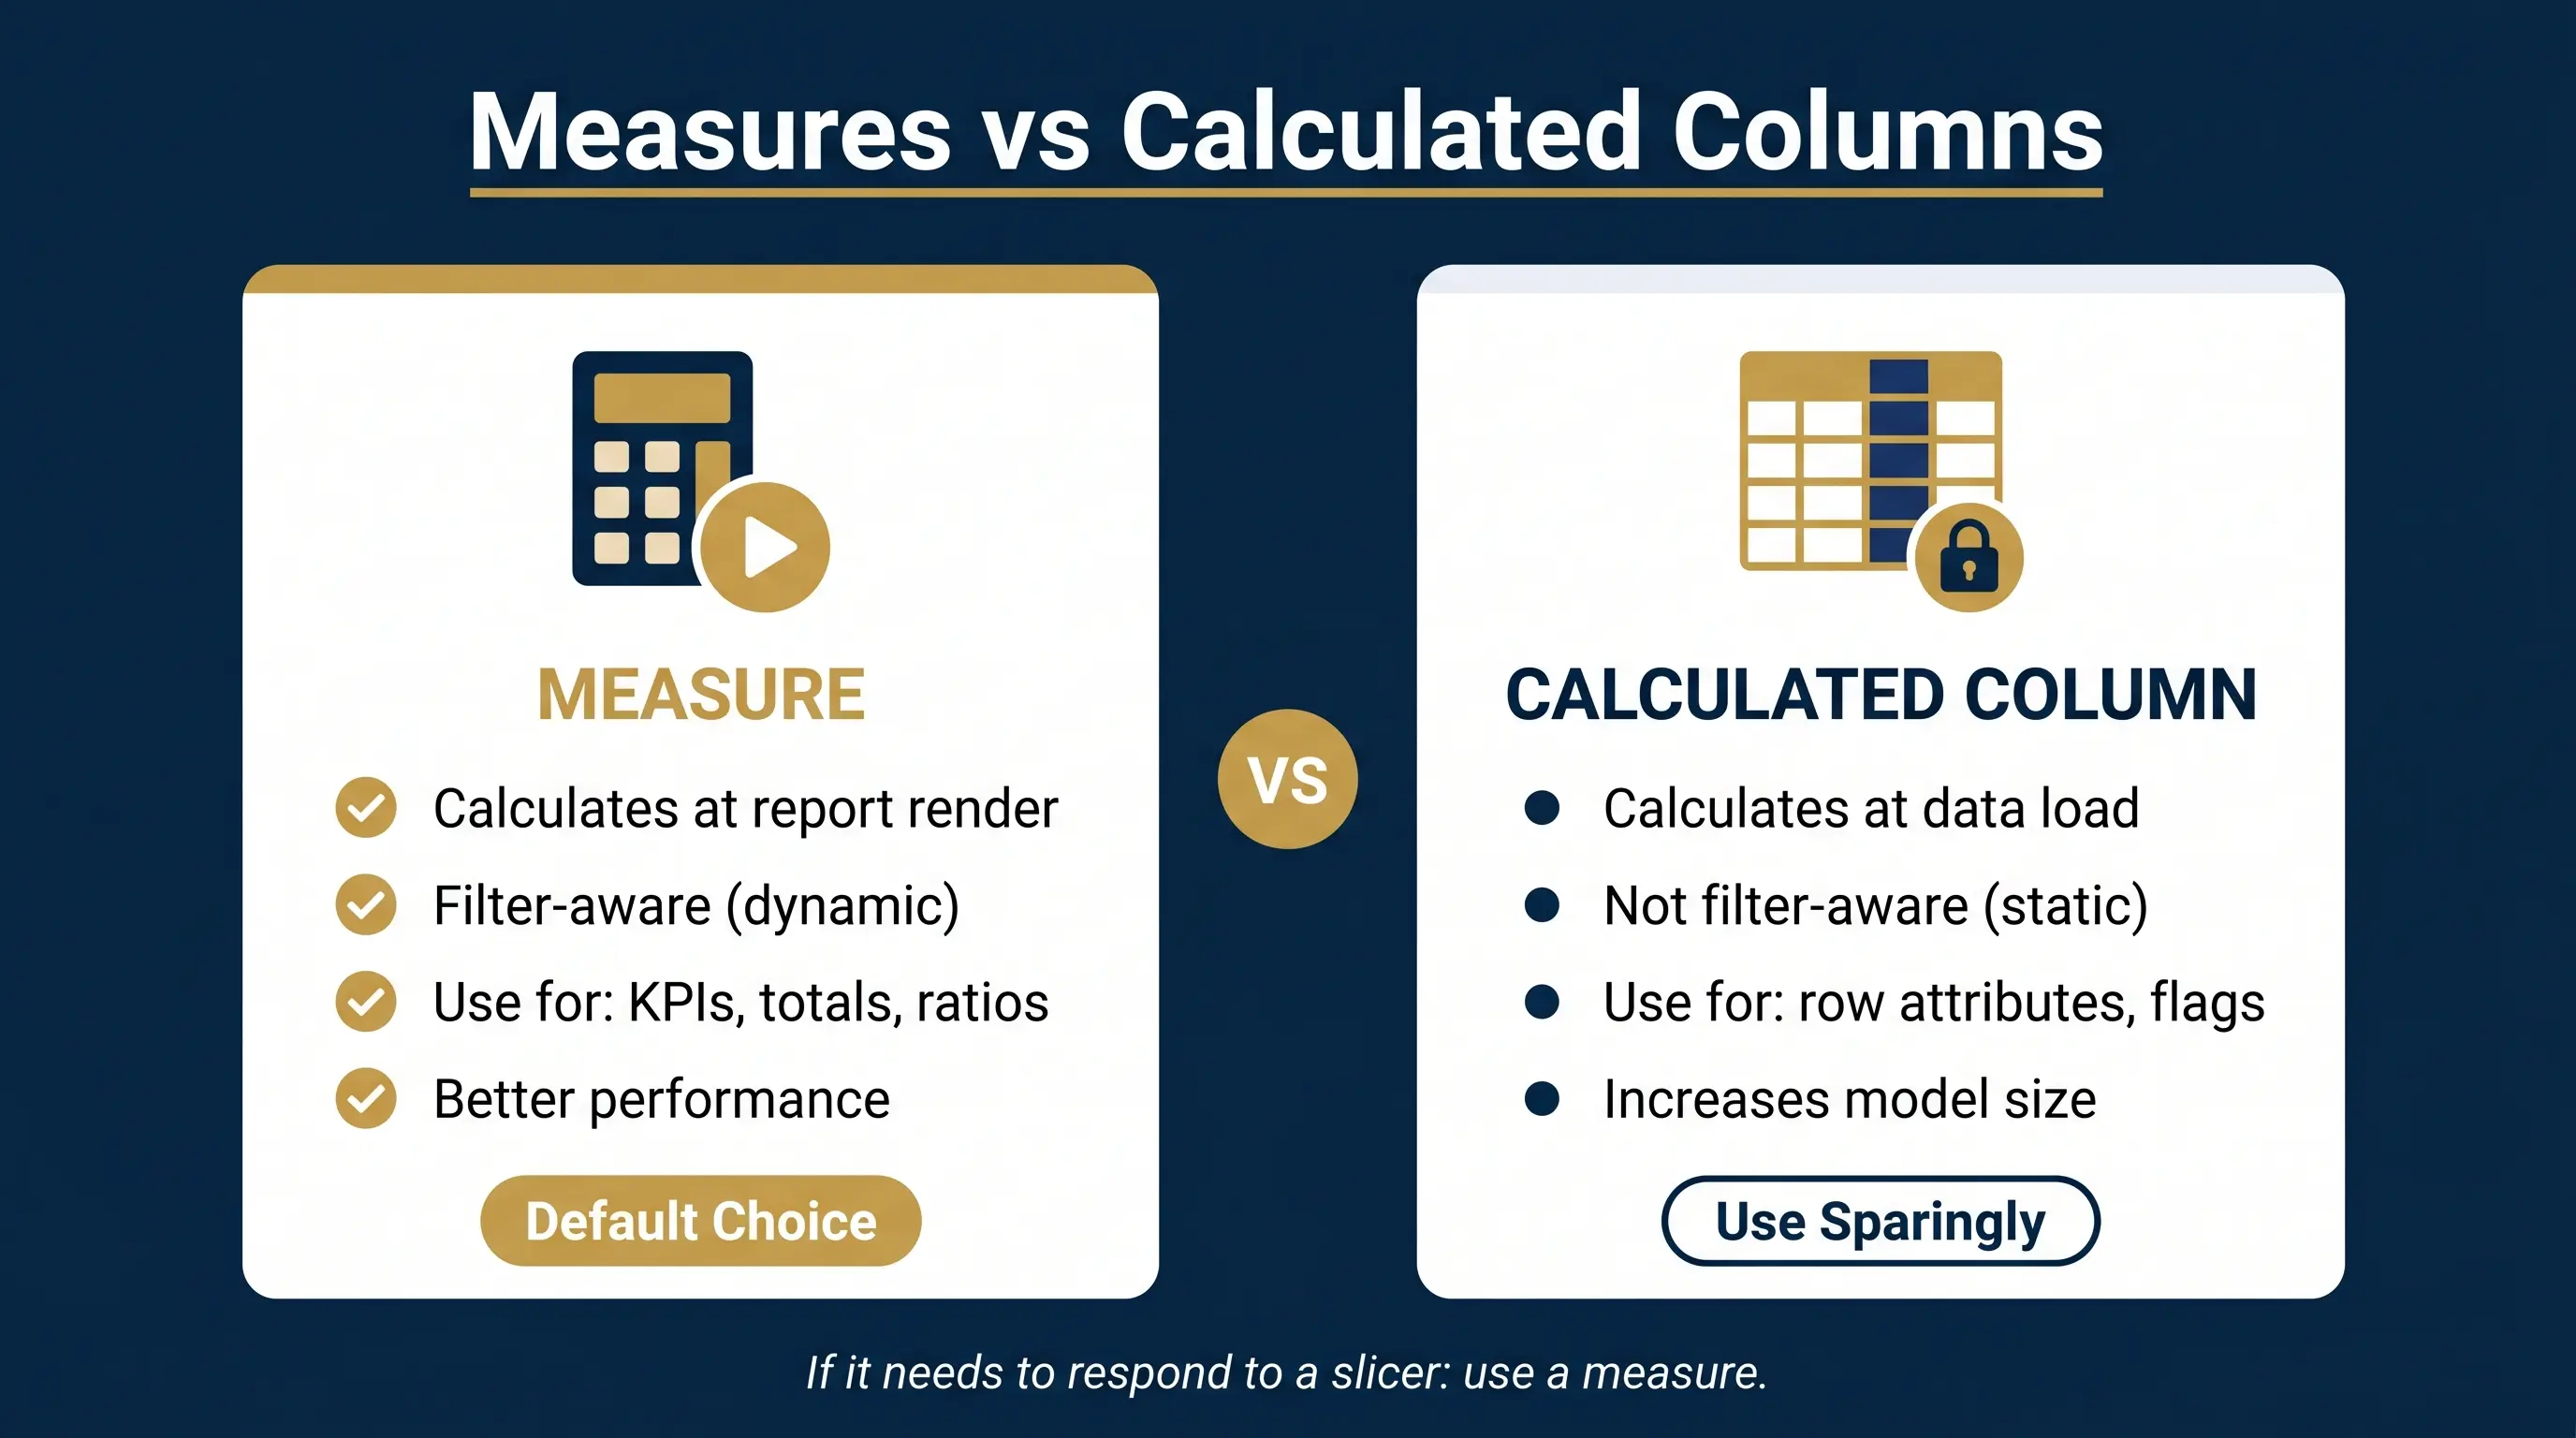
| Computed when | Report renders | Data loads/refreshes |
| Filter-aware | Yes | No |
| Lives in | Measure table / any table | A specific table |
| Good for | Aggregations, KPIs, ratios | Row-level attributes |
| Performance | Better for large datasets | Can bloat model size |
The rule of thumb: if you want a number that changes based on a slicer or filter, write a measure. If you want a fixed attribute for each row (like a category, age band, or flag), use a calculated column. Beginners overuse calculated columns because they feel more like Excel. Measures are the right default.
Pro Tip: If you only get one thing from this post, get this: DAX measures are filter-aware. Calculated columns are not. Build in measures first.
1Tier 1: The 5 Functions That Do Most of the Work
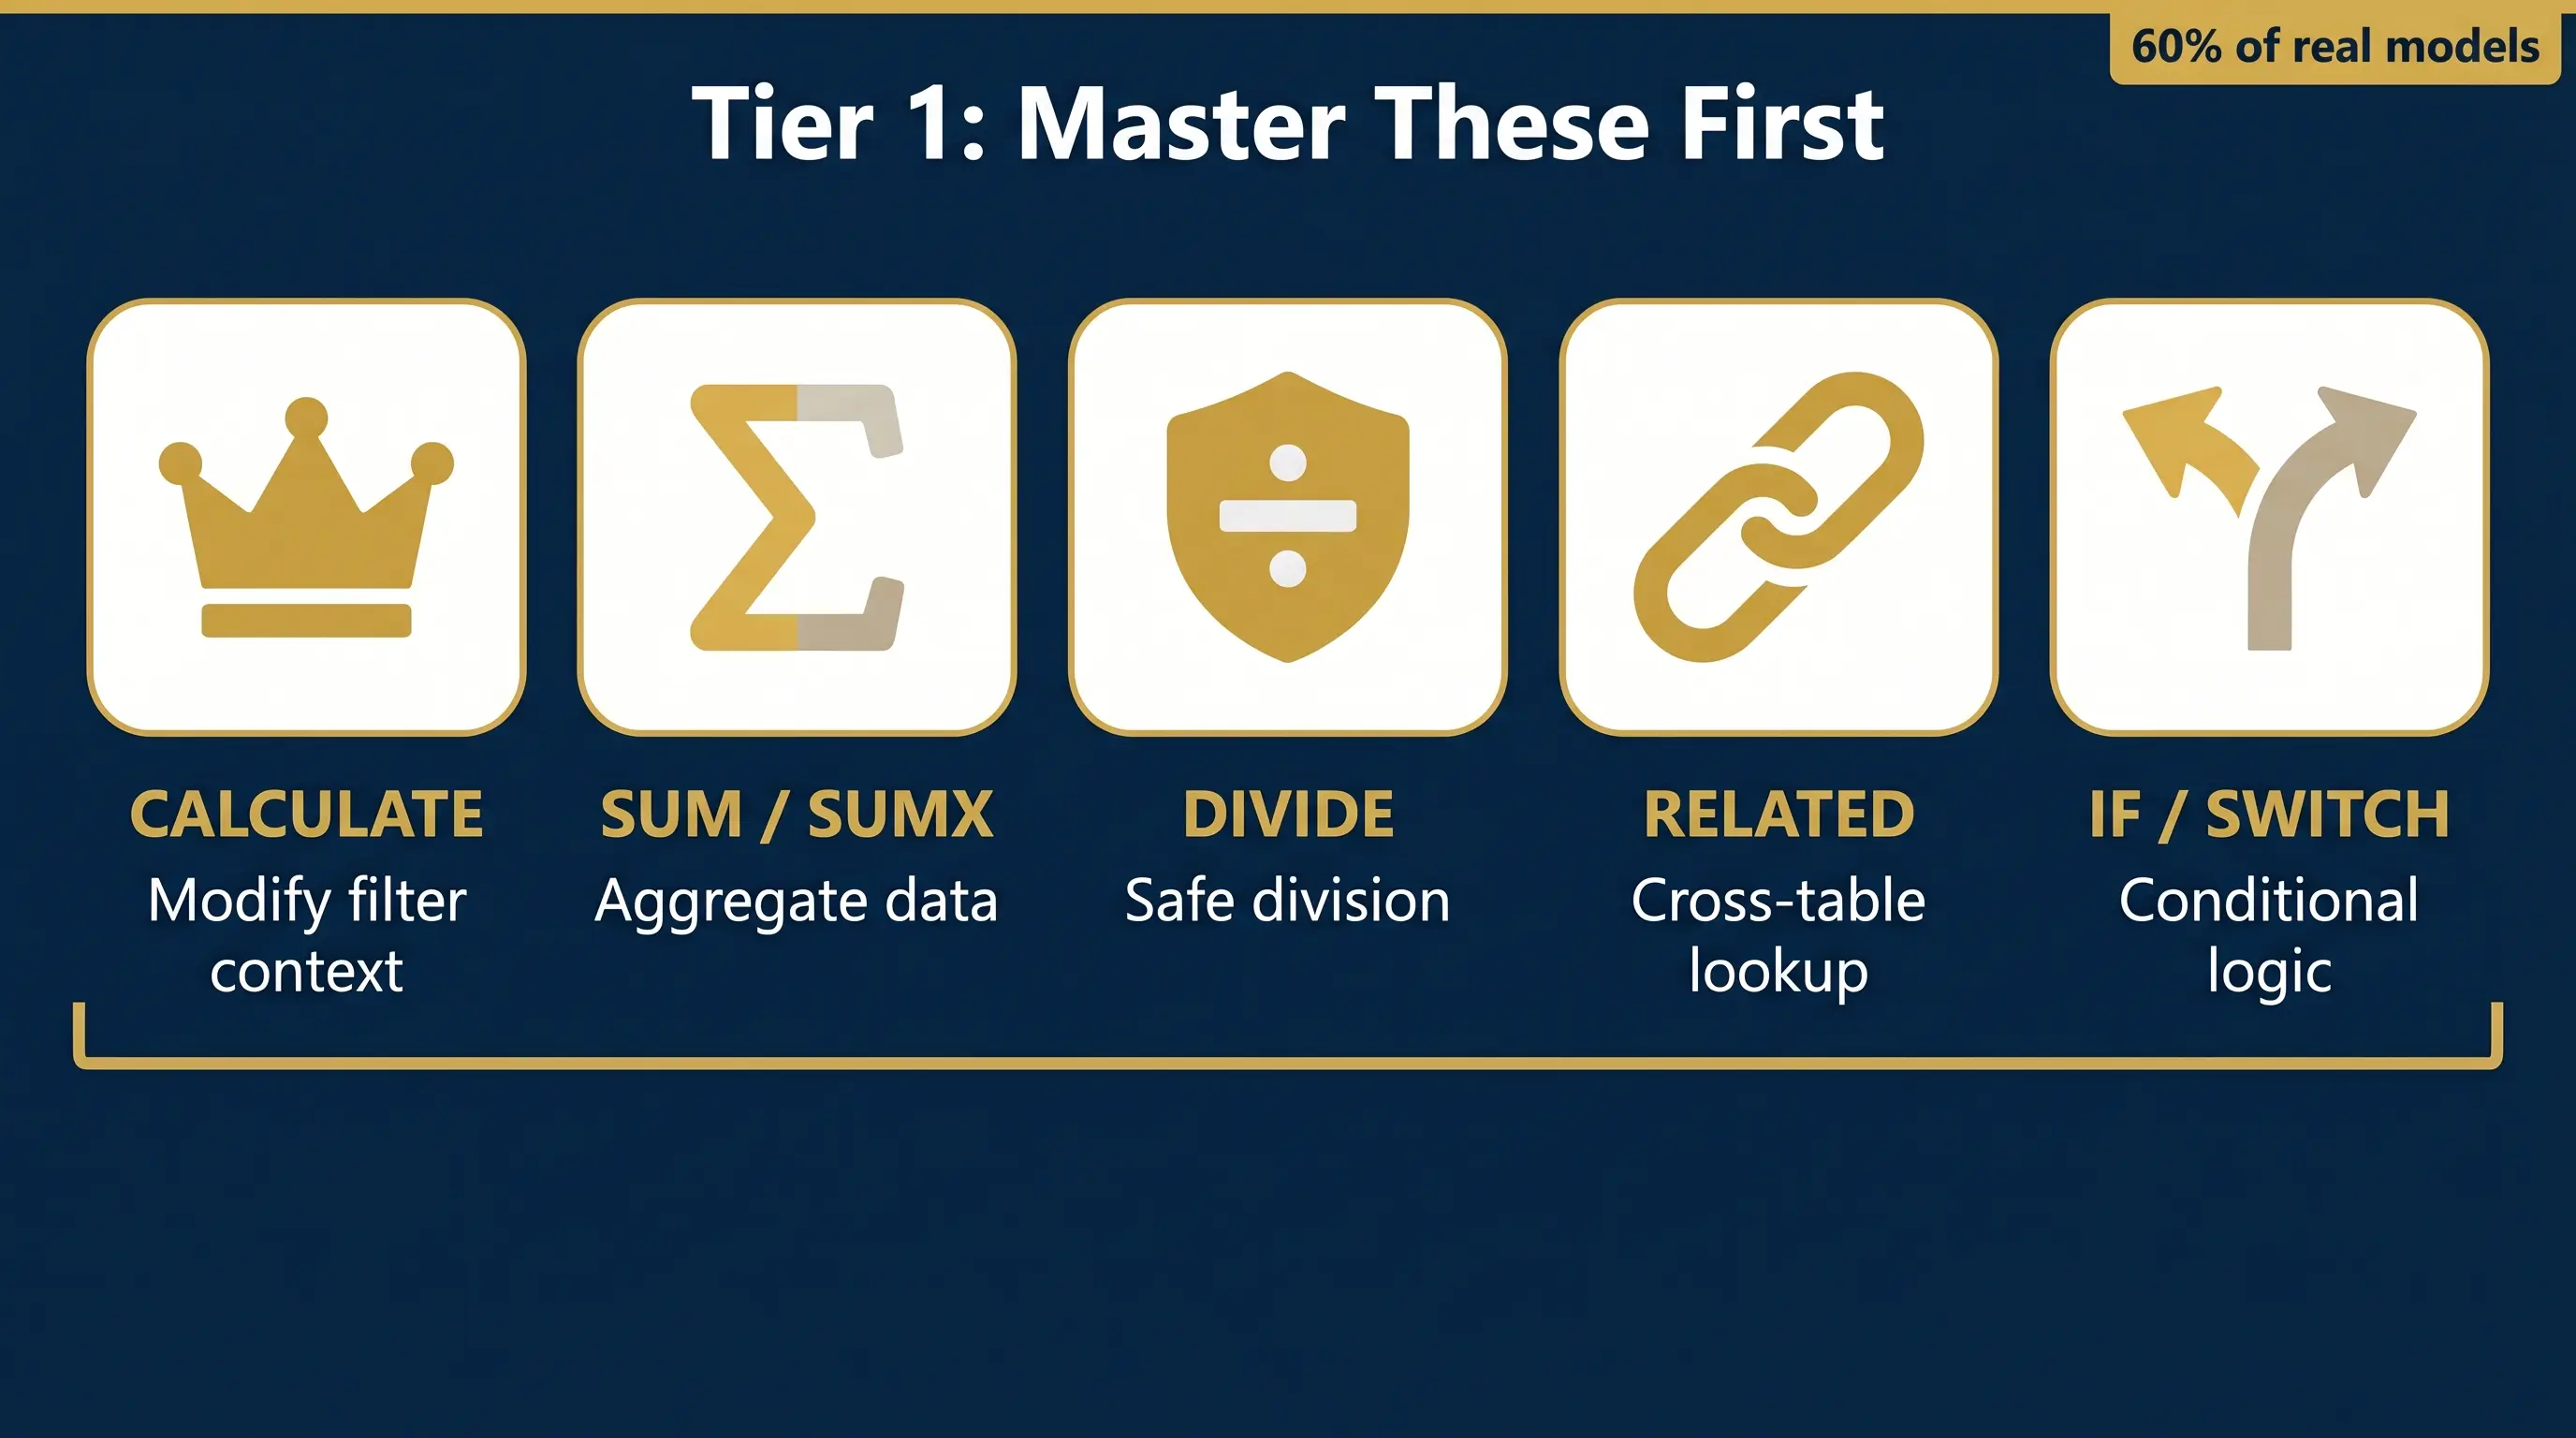
These five functions appear in the majority of real-world DAX models. Learn these first, in this order.
CALCULATE
CALCULATE is the most important function in DAX. It does one thing: it evaluates an expression inside a modified filter context. That means you can tell DAX “calculate Total Sales, but only for Product Category = Electronics” — and CALCULATE handles the filter modification.
Sales in Electronics =
CALCULATE(
    [Total Sales],
    Products[Category] = "Electronics"
)
CALCULATE takes the existing filter context, overlays a new filter on top of it, and re-evaluates the expression. CALCULATE appears in over 80% of non-trivial DAX measures. Learn it inside-out before anything else.
SUM and SUMX
SUM adds up a single column. Fast, simple, ideal for most totals. SUMX iterates row by row through a table, evaluates an expression for each row, then sums the results.
-- SUM: adds the Revenue column directly
Total Revenue = SUM(Sales[Revenue])

-- SUMX: multiplies Qty x Price per row, then sums
Total Revenue = SUMX(Sales, Sales[Quantity] * Sales[Unit Price])
When to use SUMX: When the value you need does not exist as a column and must be calculated at the row level first.
DIVIDE
Division in DAX without DIVIDE will return an error when the denominator is zero. DIVIDE handles this safely and returns a specified alternate result (default is BLANK) instead of crashing.
Gross Margin % = DIVIDE([Gross Profit], [Total Revenue], 0)
Tip: Always use DIVIDE for any ratio or percentage measure. Never use the forward slash operator alone in production DAX.
RELATED
Power BI models use relationships between tables. RELATED lets you pull a column value from a related table into the current row context. This is DAX's equivalent of VLOOKUP — but faster and relationship-aware.
Product Category = RELATED(Products[Category])
Constraint: RELATED works only in calculated columns, not in measures. For measures, use CALCULATE with a filter instead.
IF and SWITCH
IF works exactly like Excel's IF — but in DAX it is used inside measures to handle conditional logic.
Performance Band =
IF([Gross Margin %] >= 0.40, "High",
IF([Gross Margin %] >= 0.20, "Medium", "Low"))
SWITCH is the cleaner alternative when there are more than two conditions to check:
Region Label =
SWITCH(
    Sales[Country],
    "SA", "Saudi Arabia",
    "BH", "Bahrain",
    "AE", "UAE",
    "Other"
)
If you can write measures using CALCULATE, SUM/SUMX, DIVIDE, RELATED, and IF, you can build 60% of the DAX measures in most business reports. Everything else extends these foundations.
2Tier 2: Time Intelligence — The Functions Every Finance and Business Report Needs
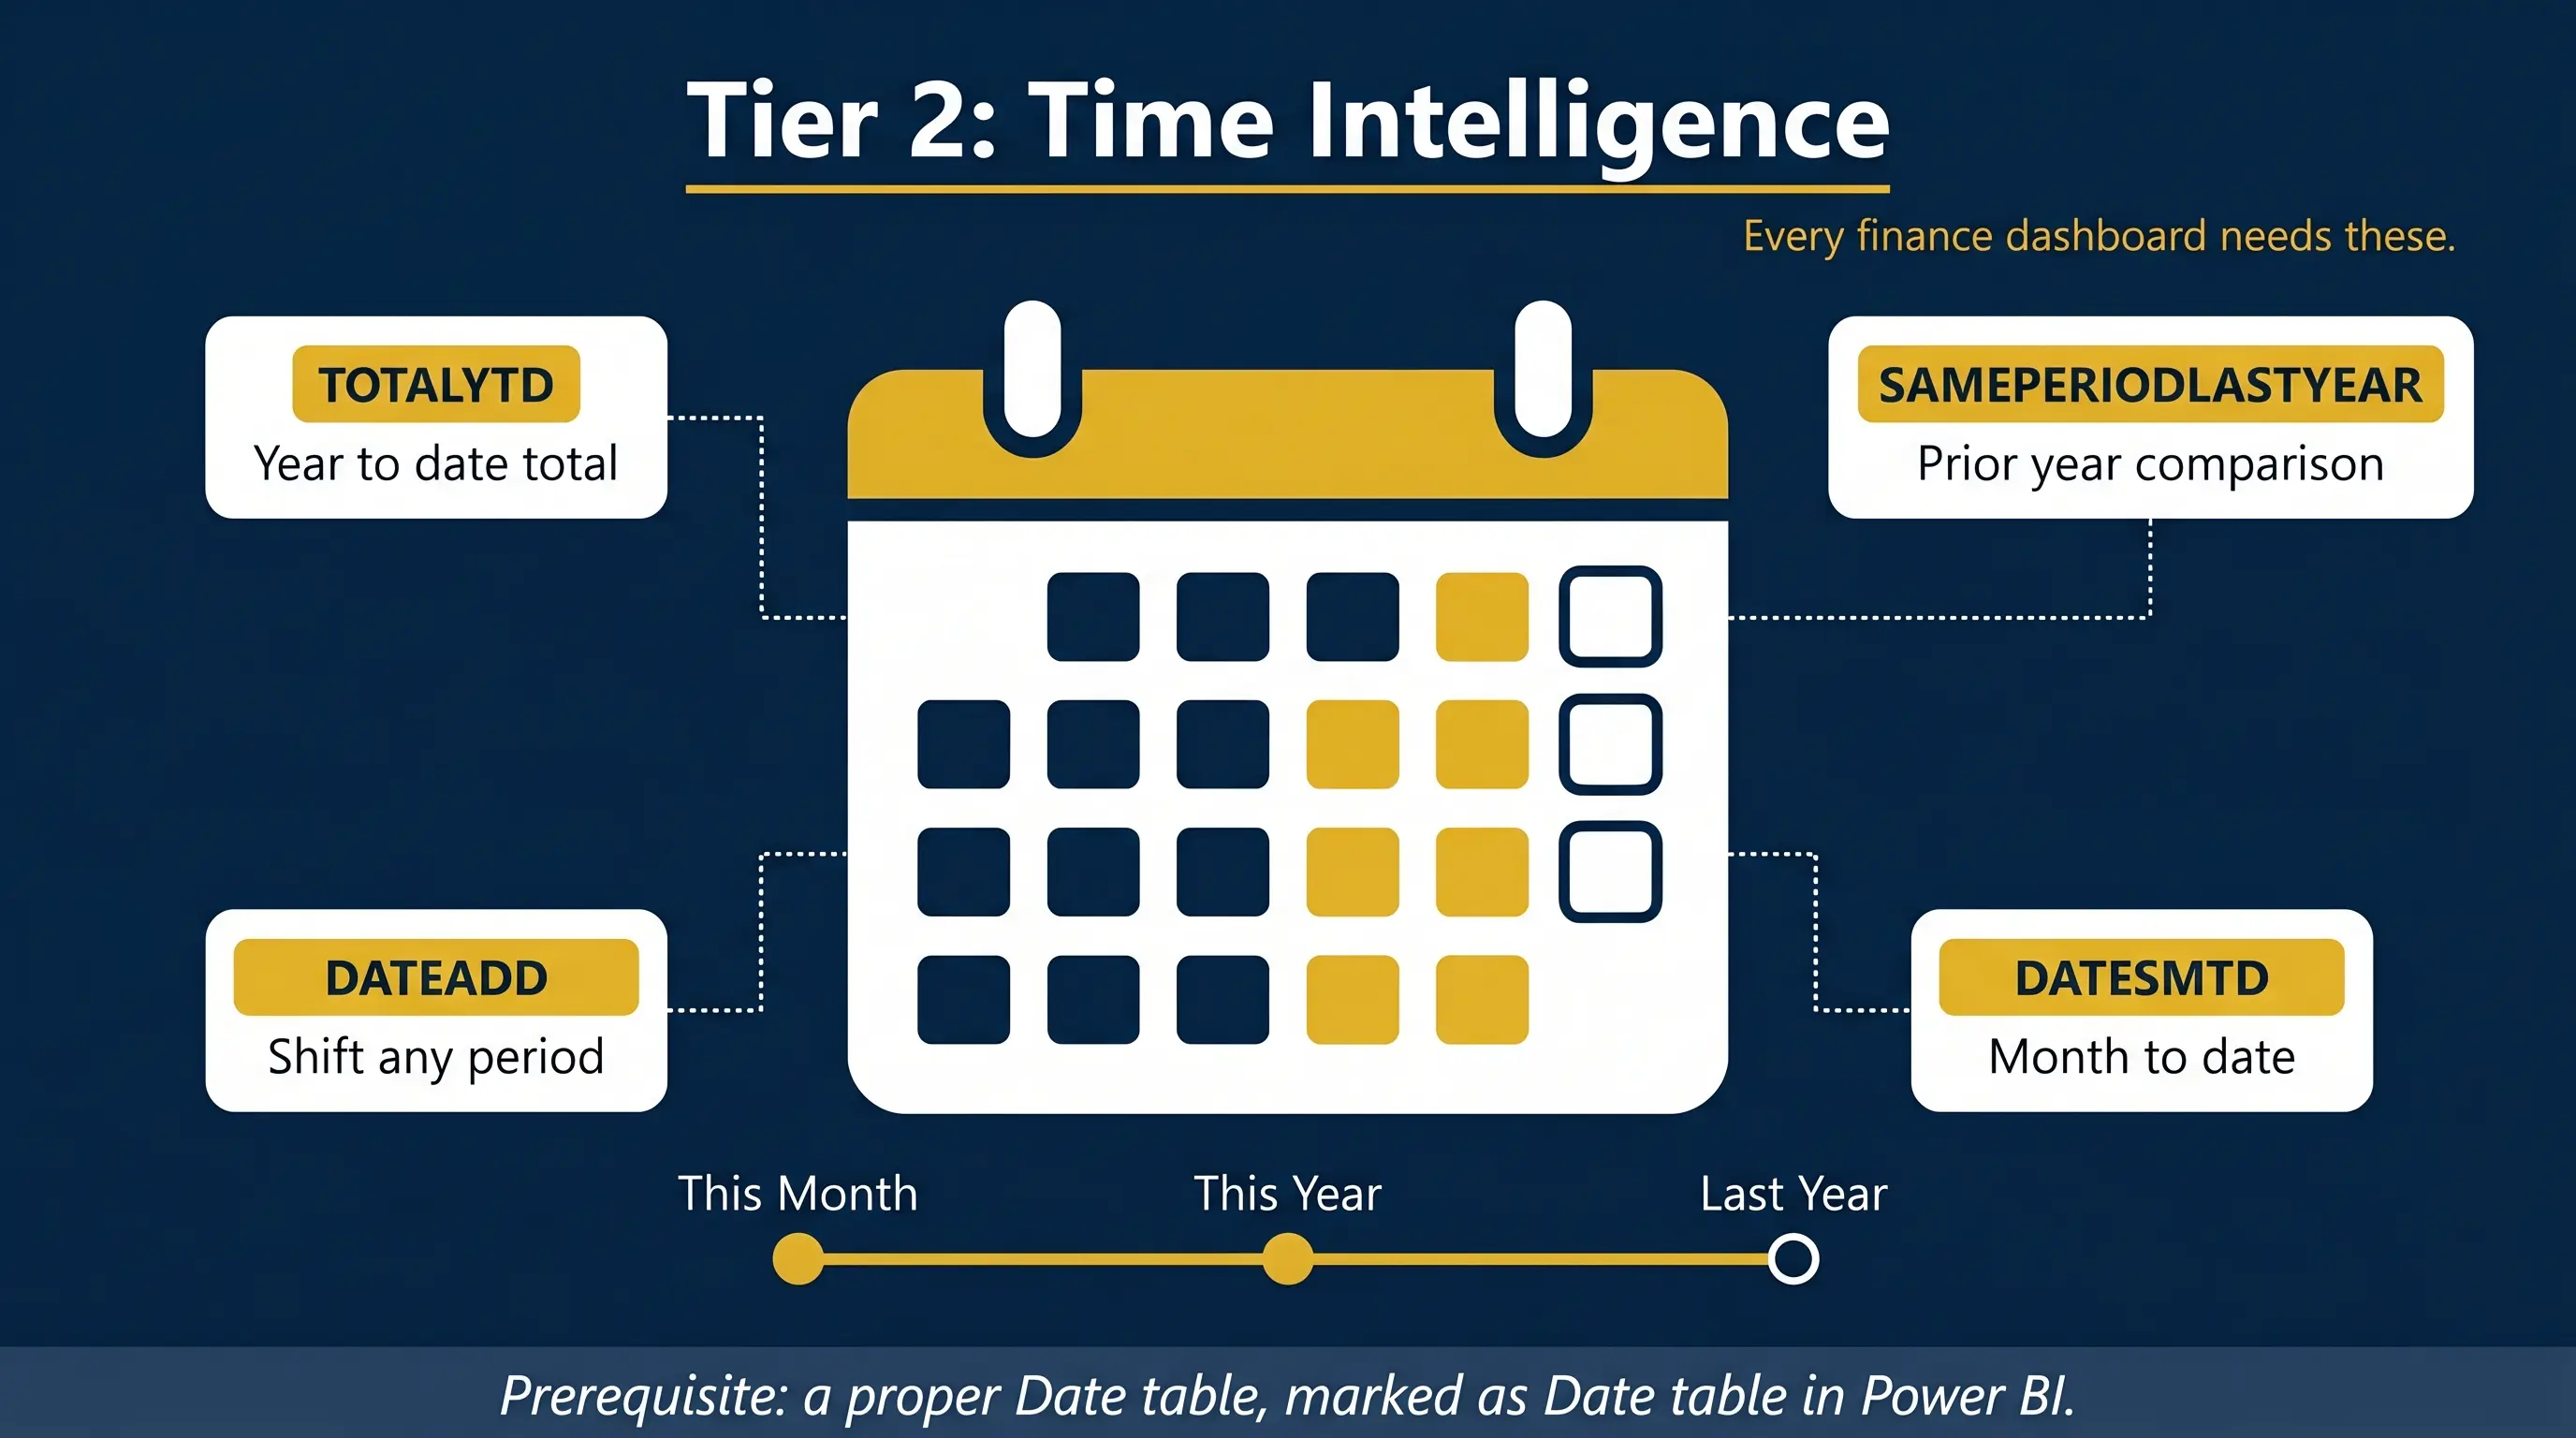
Every business report eventually needs year-to-date totals, year-on-year comparisons, and rolling averages. DAX has a dedicated family of time intelligence functions for exactly this — but they only work if your model has a proper Date table marked as a Date table in Power BI.
Requirement
All time intelligence functions in DAX require a dedicated Date table with a contiguous range of dates (no gaps), a single Date column of data type Date, and the table must be marked as a Date table in Power BI Desktop (right-click the table → Mark as Date Table).
TOTALYTD
YTD Revenue = TOTALYTD([Total Revenue], Dates[Date])
This returns the year-to-date cumulative total from the start of the calendar year to the current filter context date. For fiscal year, use the optional year-end date argument:
YTD Revenue (Fiscal) = TOTALYTD([Total Revenue], Dates[Date], "31/03")
SAMEPERIODLASTYEAR
Revenue LY = CALCULATE([Total Revenue], SAMEPERIODLASTYEAR(Dates[Date]))
This shifts the entire filter context back exactly one year, enabling year-over-year comparison. Pair it with DIVIDE to create a YoY Growth % measure:
YoY Growth % = DIVIDE([Total Revenue] - [Revenue LY], [Revenue LY], 0)
DATEADD
DATEADD is the more flexible alternative. It shifts the date range by any number of days, months, quarters, or years.
Revenue PM = CALCULATE([Total Revenue], DATEADD(Dates[Date], -1, MONTH))
Revenue PY = CALCULATE([Total Revenue], DATEADD(Dates[Date], -1, YEAR))
DATESYTD / DATESMTD
These are the table-returning versions of TOTALYTD, used inside CALCULATE for more flexible YTD logic.
These four time intelligence functions — TOTALYTD, SAMEPERIODLASTYEAR, DATEADD, and DATESMTD — cover the time comparisons in virtually every management reporting pack. Master these and every finance dashboard becomes buildable.
3Tier 3: Six More Functions That Complete the 80% Picture
Once Tier 1 and Tier 2 are solid, these six functions unlock the patterns that make Power BI reports genuinely impressive.
ALL and ALLEXCEPT
ALL removes all filters from a column or table, which is critical for calculating percentage of total.
% of Total Sales =
DIVIDE(
    [Total Revenue],
    CALCULATE([Total Revenue], ALL(Sales))
)
ALLEXCEPT removes all filters except those you specify — useful for partial filter removal (e.g. keep the Year filter but remove the Product filter).
COUNTROWS and DISTINCTCOUNT
Number of Transactions = COUNTROWS(Sales)
Number of Customers = DISTINCTCOUNT(Sales[Customer ID])
COUNTROWS counts every row in a filtered table. DISTINCTCOUNT counts unique values in a column. Both appear constantly in operational dashboards.
RANKX
Product Rank = RANKX(ALL(Products), [Total Revenue], , DESC, Dense)
RANKX ranks a value across a table. The ALL() wrapper means the rank is computed against all products, not just the ones visible in the current filter context.
VAR and RETURN
This is the single most important readability improvement in DAX. Variables let you store intermediate calculations, reuse them, and avoid repeating the same expression multiple times in one measure.
Gross Margin % =
VAR GrossProfit = [Revenue] - [COGS]
VAR TotalRevenue = [Revenue]
RETURN
    DIVIDE(GrossProfit, TotalRevenue, 0)
Once you start using VAR/RETURN, you will never write complex nested measures without it. It also dramatically improves debuggability.
HASONEVALUE
Dynamic Title =
IF(
    HASONEVALUE(Products[Category]),
    "Sales for " & SELECTEDVALUE(Products[Category]),
    "All Categories"
)
HASONEVALUE returns TRUE when a column has been filtered to a single value — useful for dynamic titles, conditional card formatting, and showing context-aware labels.
FILTER
High Value Customers =
CALCULATE(
    [Total Revenue],
    FILTER(Customers, Customers[Lifetime Value] > 10000)
)
FILTER returns a subset of a table meeting a condition, used inside CALCULATE when a simple column filter is not enough. CALCULATE with a direct column filter is faster than FILTER for simple conditions — use FILTER only when the condition involves a measure or a calculated expression.
Your 90-Day DAX Learning Roadmap
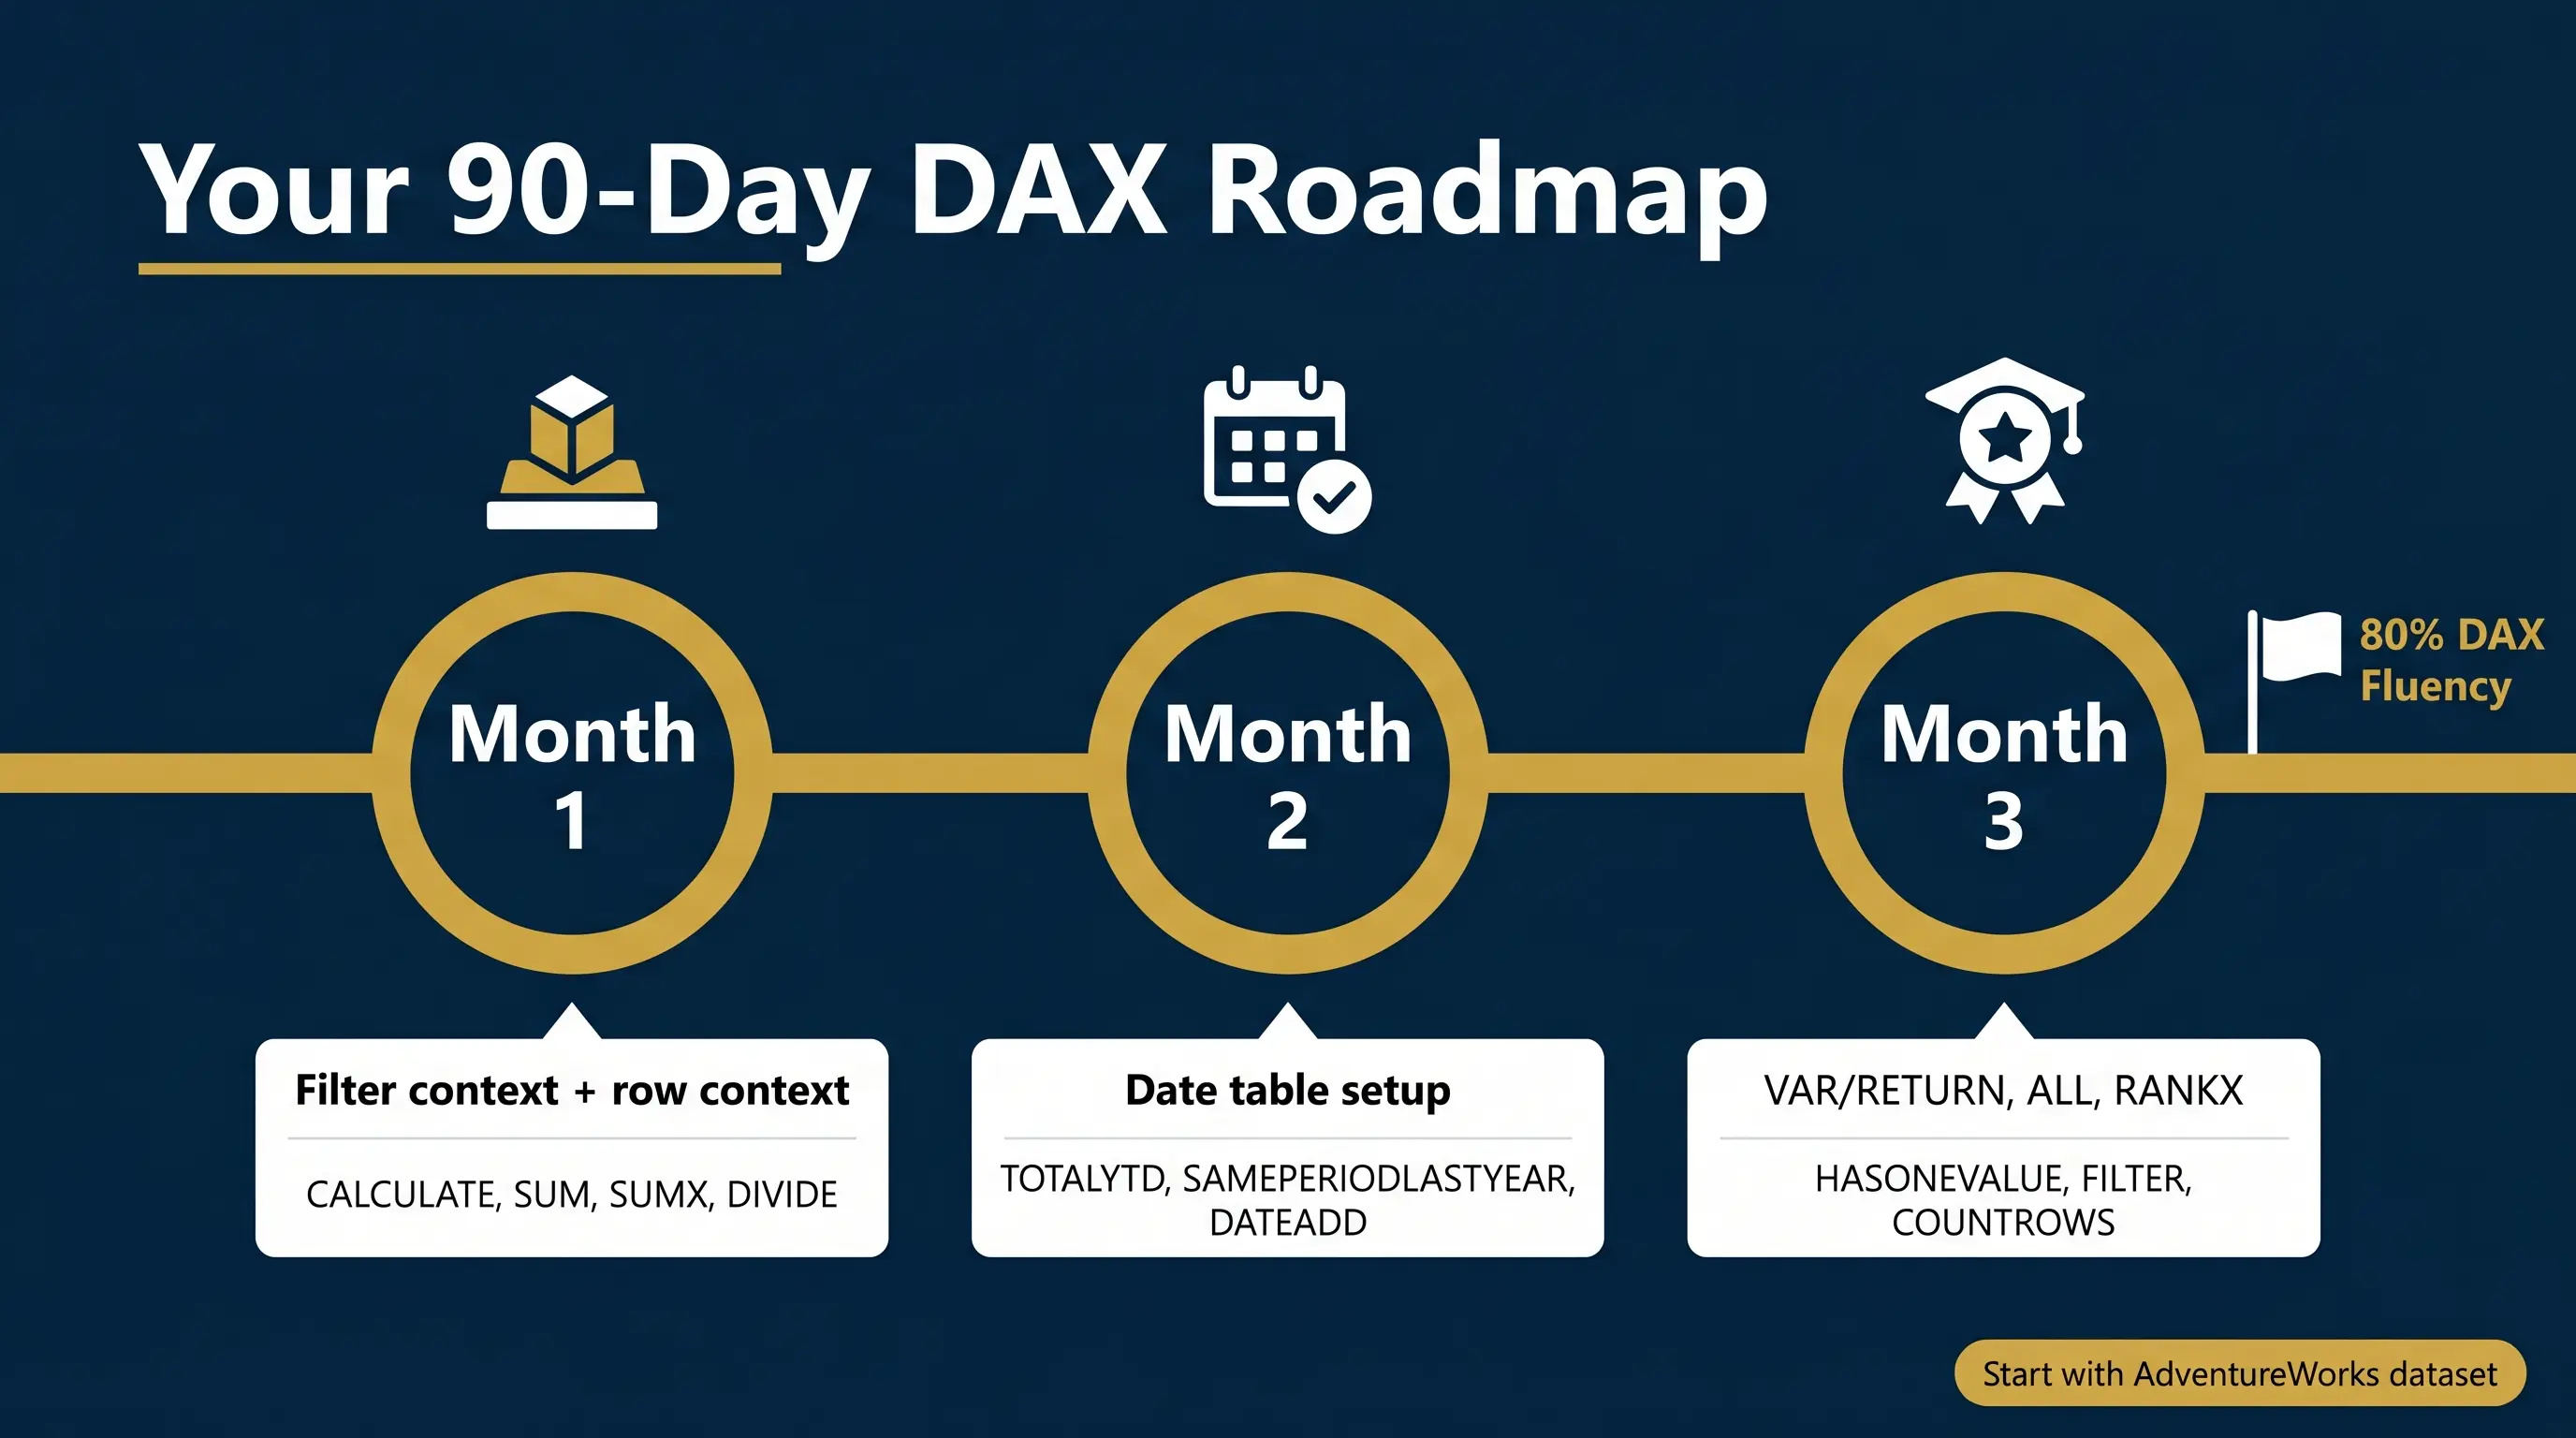
Month 1: Foundations
Week 1-2: Filter context and row context. Measures vs calculated columns. Do not write a single complex formula yet.
Week 3-4: CALCULATE, SUM, SUMX, DIVIDE. Build 10 measures from scratch on a real dataset (use the Microsoft AdventureWorks sample).
Month 2: Core Patterns
Week 5-6: Time intelligence. Set up a proper Date table. Build TOTALYTD, SAMEPERIODLASTYEAR, and DATEADD measures.
Week 7-8: ALL, ALLEXCEPT, COUNTROWS, DISTINCTCOUNT. Build a % of total and a ranking table.
Month 3: Fluency
Week 9-10: VAR/RETURN — rewrite your existing measures to use variables.
Week 11-12: RANKX, HASONEVALUE, FILTER. Build a dynamic title, a ranked product table, and a filtered revenue measure.
After 90 days on this track, you will have the DAX vocabulary to handle roughly 80% of what appears in real-world Power BI models. The remaining 20% — advanced patterns, SWITCH true, context transition edge cases, user-defined functions — comes with experience and problem-solving, not more memorisation.
The Tools and Resources Every DAX Beginner Should Be Using
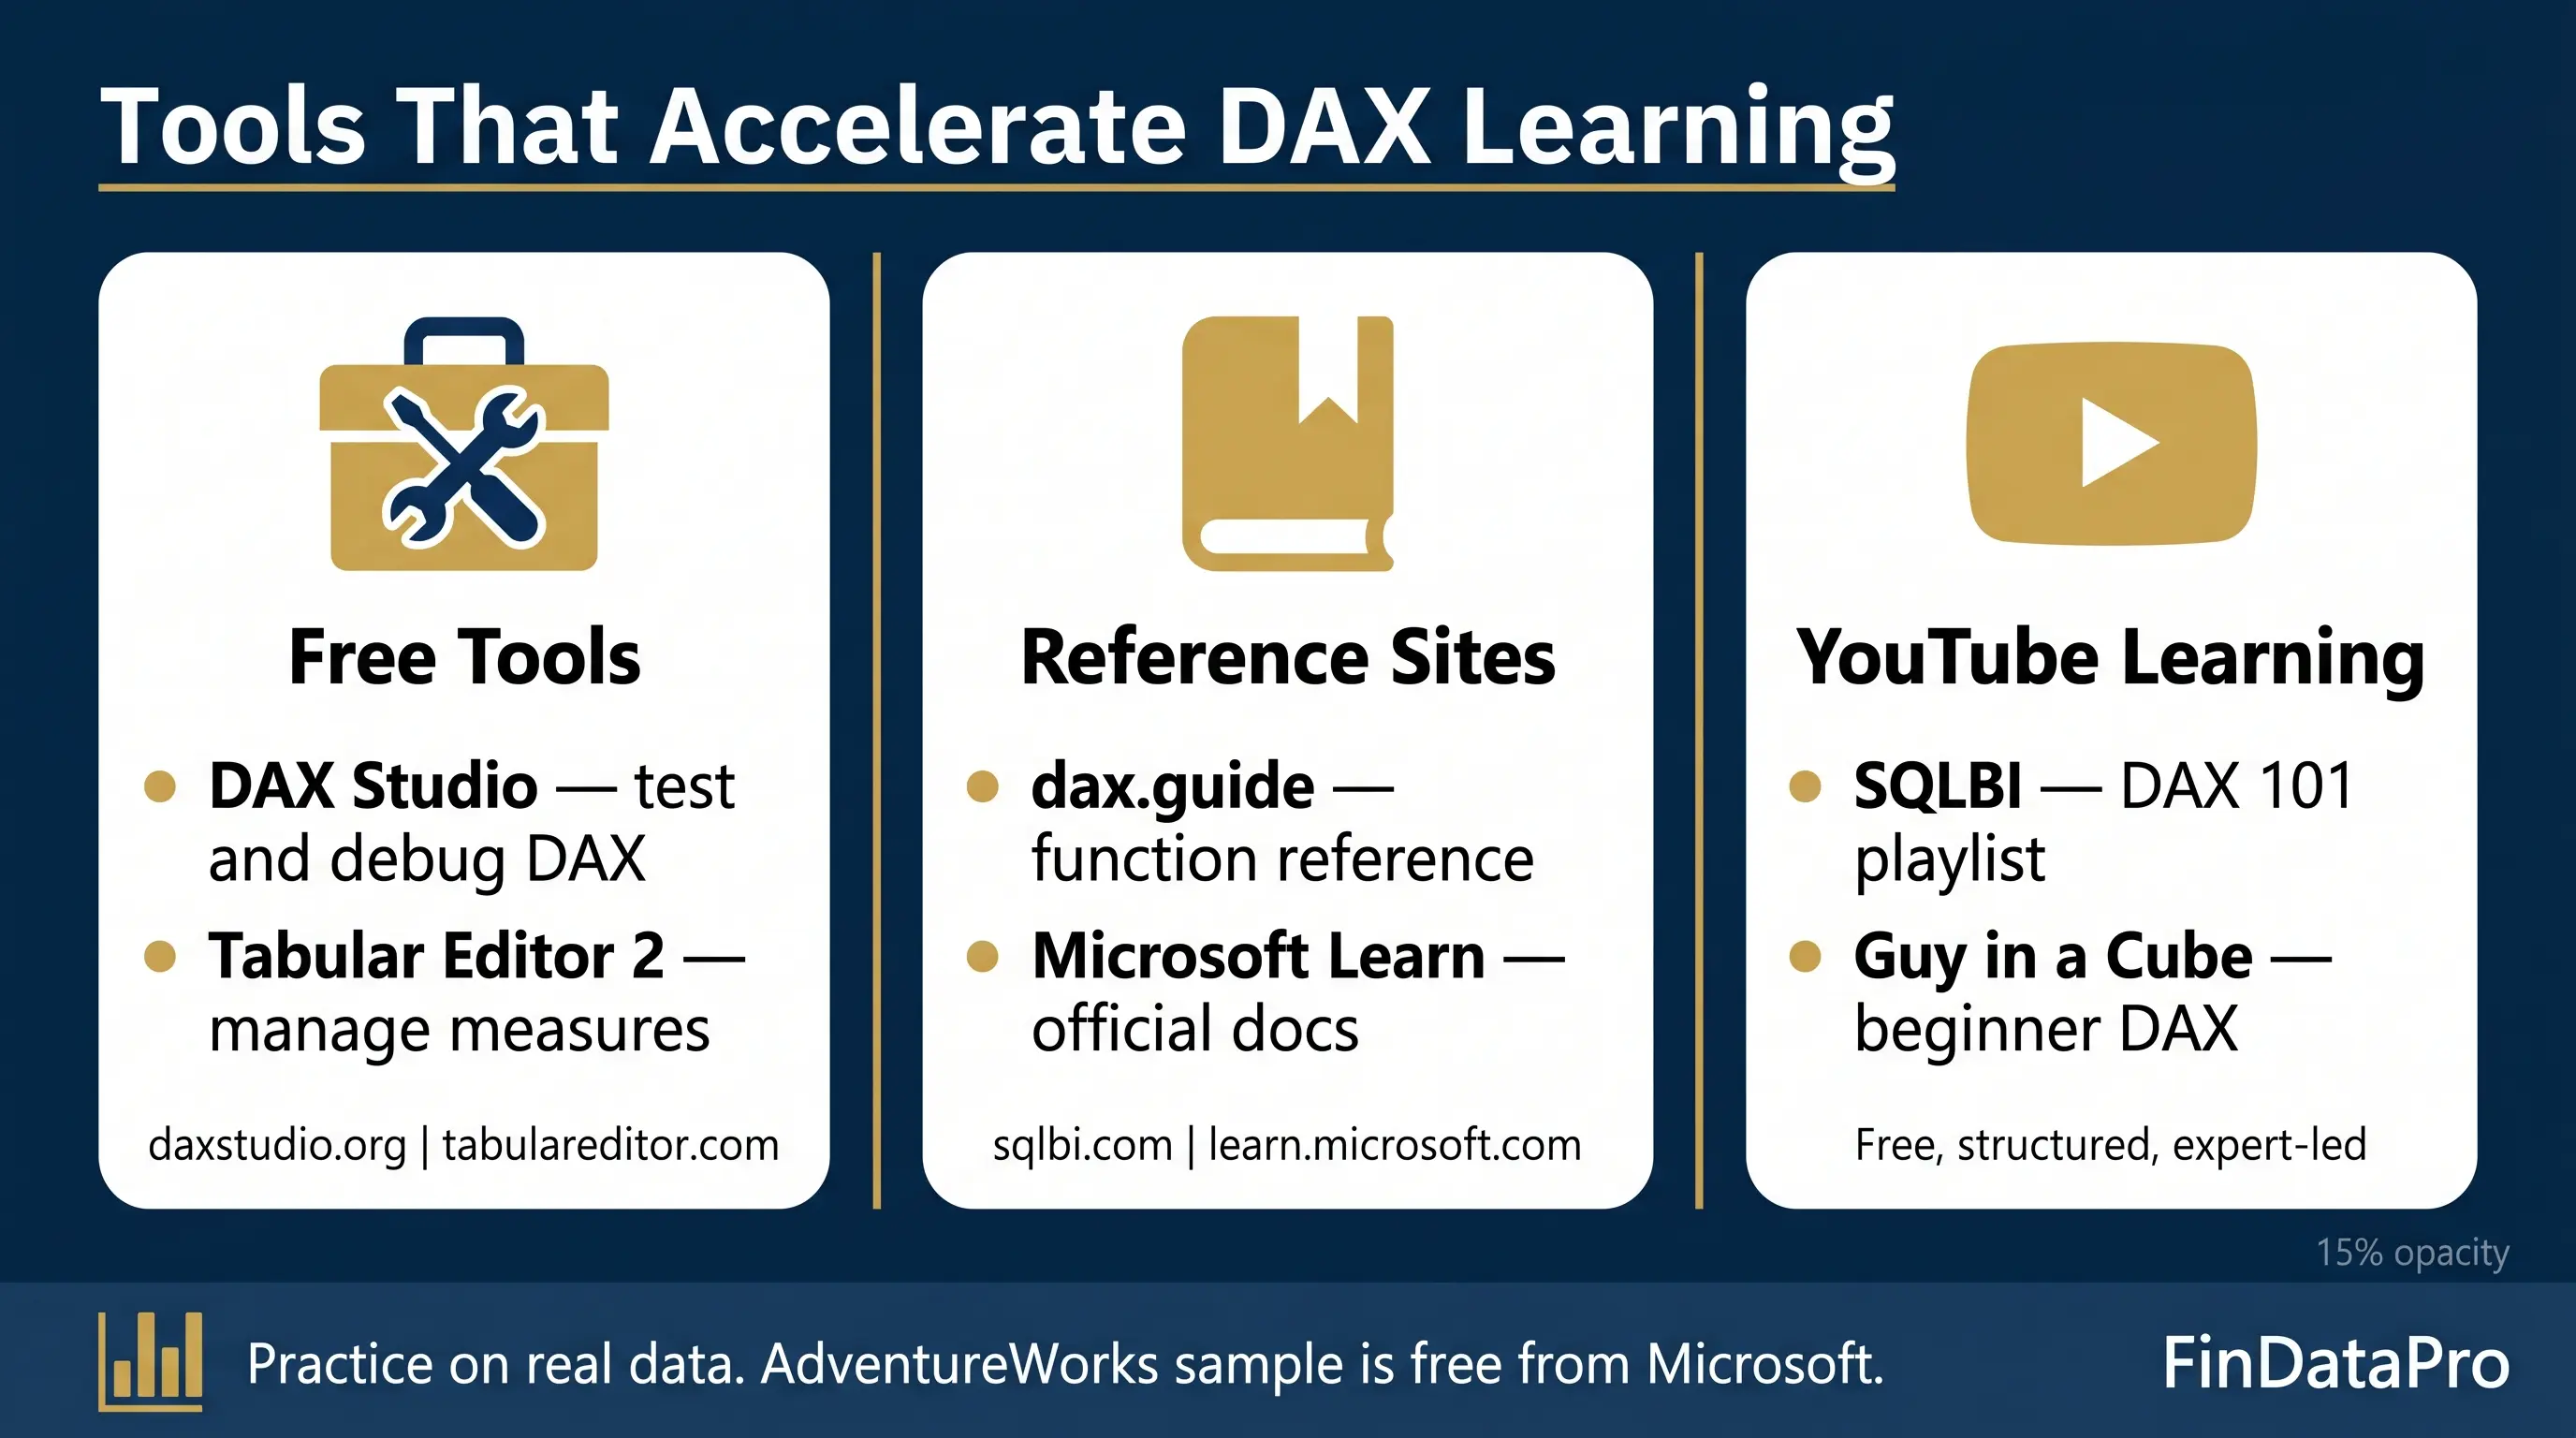
Free Tools
DAX Studio
(free standalone tool): Use this to run and test DAX queries outside Power BI Desktop. See exactly what filters are active, what a measure returns, and where performance degrades. Download at daxstudio.org. Essential from month 2 onwards.
Visit SiteTabular Editor 2
(free community edition): Manage and organise measures, folders, and descriptions. Speeds up model documentation significantly. Free version available at tabulareditor.com.
Visit SiteReference Sites
DAX Guide by SQLBI
https://dax.guide — The best function reference on the internet. Every DAX function with syntax, examples, and articles. Written by Marco Russo and Alberto Ferrari, the two most respected DAX authorities globally.
Microsoft DAX Function Reference
https://learn.microsoft.com/en-us/dax/dax-function-reference — Microsoft's official documentation. Dry but comprehensive. Cross-reference against DAX Guide for practical context.
SQLBI.com
https://www.sqlbi.com — Free articles, patterns, and courses on DAX and data modelling. Their “Introducing DAX” free video course is the best structured beginner course available online.
YouTube Resources
SQLBI — “Introducing DAX” Free Course Playlist
Channel: SQLBI (Marco Russo and Alberto Ferrari)
Free structured course covering DAX from zero. Start with the “DAX 101” playlist. These are the two people who literally wrote the book on DAX — The Definitive Guide to DAX, now in its third edition.
Watch on YouTubeGuy in a Cube — “TAME the Beast That is DAX in Power BI”
Patrick from Guy in a Cube explains how to approach learning DAX without getting overwhelmed. Essential first watch before you open any function reference.
Learn 80% of DAX in an Hour (with FREE sample file)
One of the clearest explanations of CALCULATE and filter context available. Leila uses visual walkthroughs that make the concept click faster than any written tutorial.
Power BI DAX Full Course for Beginners
A 3-hour DAX tutorial covering DAX fundamentals, row context, the CALCULATE function, and context transition. Good for structured video learners who want one complete resource.
If I Had to Relearn Power BI From Scratch, Here's What I'd Do Differently
The definitive explanation of when to use SUM and when to use SUMX. Clears up one of the most common beginner misconceptions in DAX.
Frequently Asked Questions About Learning DAX
How long does it realistically take to become proficient in DAX?
Do I need to know SQL or other programming languages before learning DAX?
Why does my CALCULATE function sometimes return the same result as the base measure?
Should I learn Power Query before DAX?
What's the difference between a measure and a calculated column, and when should I use each?
Can I use DAX with Excel, or is it only for Power BI?
Why do time intelligence functions require a Date table?
What's the most common mistake beginners make with DAX?
How do I debug a DAX measure that returns the wrong result?
Is SUMX slower than SUM, and does it matter?
Do I need to memorise all the time intelligence functions?
Can I learn DAX without taking a paid course?
What's the best practice dataset for learning DAX?
Should I learn DAX or Python for Power BI?
How do I know when I've moved beyond beginner level in DAX?
The Fastest Way to Get Good at DAX Is to Stop Trying to Learn All of It
The function library has 250+ entries, but 15-20 functions and 2 foundational concepts account for the vast majority of real-world DAX work. Trying to learn everything at once is a guaranteed way to stay stuck.
The three-tier structure works: Tier 1 (CALCULATE, SUM/SUMX, DIVIDE, RELATED, IF) builds the core. Tier 2 (time intelligence) unlocks business reporting. Tier 3 (ALL, COUNTROWS, RANKX, VAR, HASONEVALUE, FILTER) rounds out 80% of what any analyst needs.
Download the Microsoft AdventureWorks sample dataset, open Power BI Desktop, and write one measure from each tier this week. Not reading about DAX — writing it. Before you build any complex model, understand Power Query for beginners — clean data preparation makes every DAX formula easier. A well-structured star schema model is the foundation for readable, maintainable DAX.
For finance professionals working with fiscal calendars or Hijri date tables, the dedicated DAX time intelligence for finance teams post covers those patterns in depth. If you're building financial models in Excel alongside Power BI, check out the free FinDataPro Excel finance tools — built for GCC finance professionals who need both platforms working together.
Ready to Build Better Models?
If you want to streamline your analytics workflow, mastering the right DAX functions is just the beginning. Explore our professional templates and training.
Prashant Panchal is a Chartered Accountant (ACA) and Financial Modelling & Valuation Analyst (FMVA®) with 19 years of experience in finance, FP&A, and financial modelling across the GCC region. He is the founder of FinDataPro.
Discussion
Leave a Comment
Comments are moderated and appear once approved.