What is Power Query? The Complete Guide for Financial & Accounting ProfessionalsStop spending 40% of your week on data cleanup. Here's the tool hiding inside Excel that changes everything.

If you're spending hours every week copying bank statements into Excel, manually reconciling payroll data, or reformatting financial reports from your accounting software, there's a tool hiding inside your Excel that can automate 80% of that work. It's called Power Query, and most finance professionals have never heard of it.
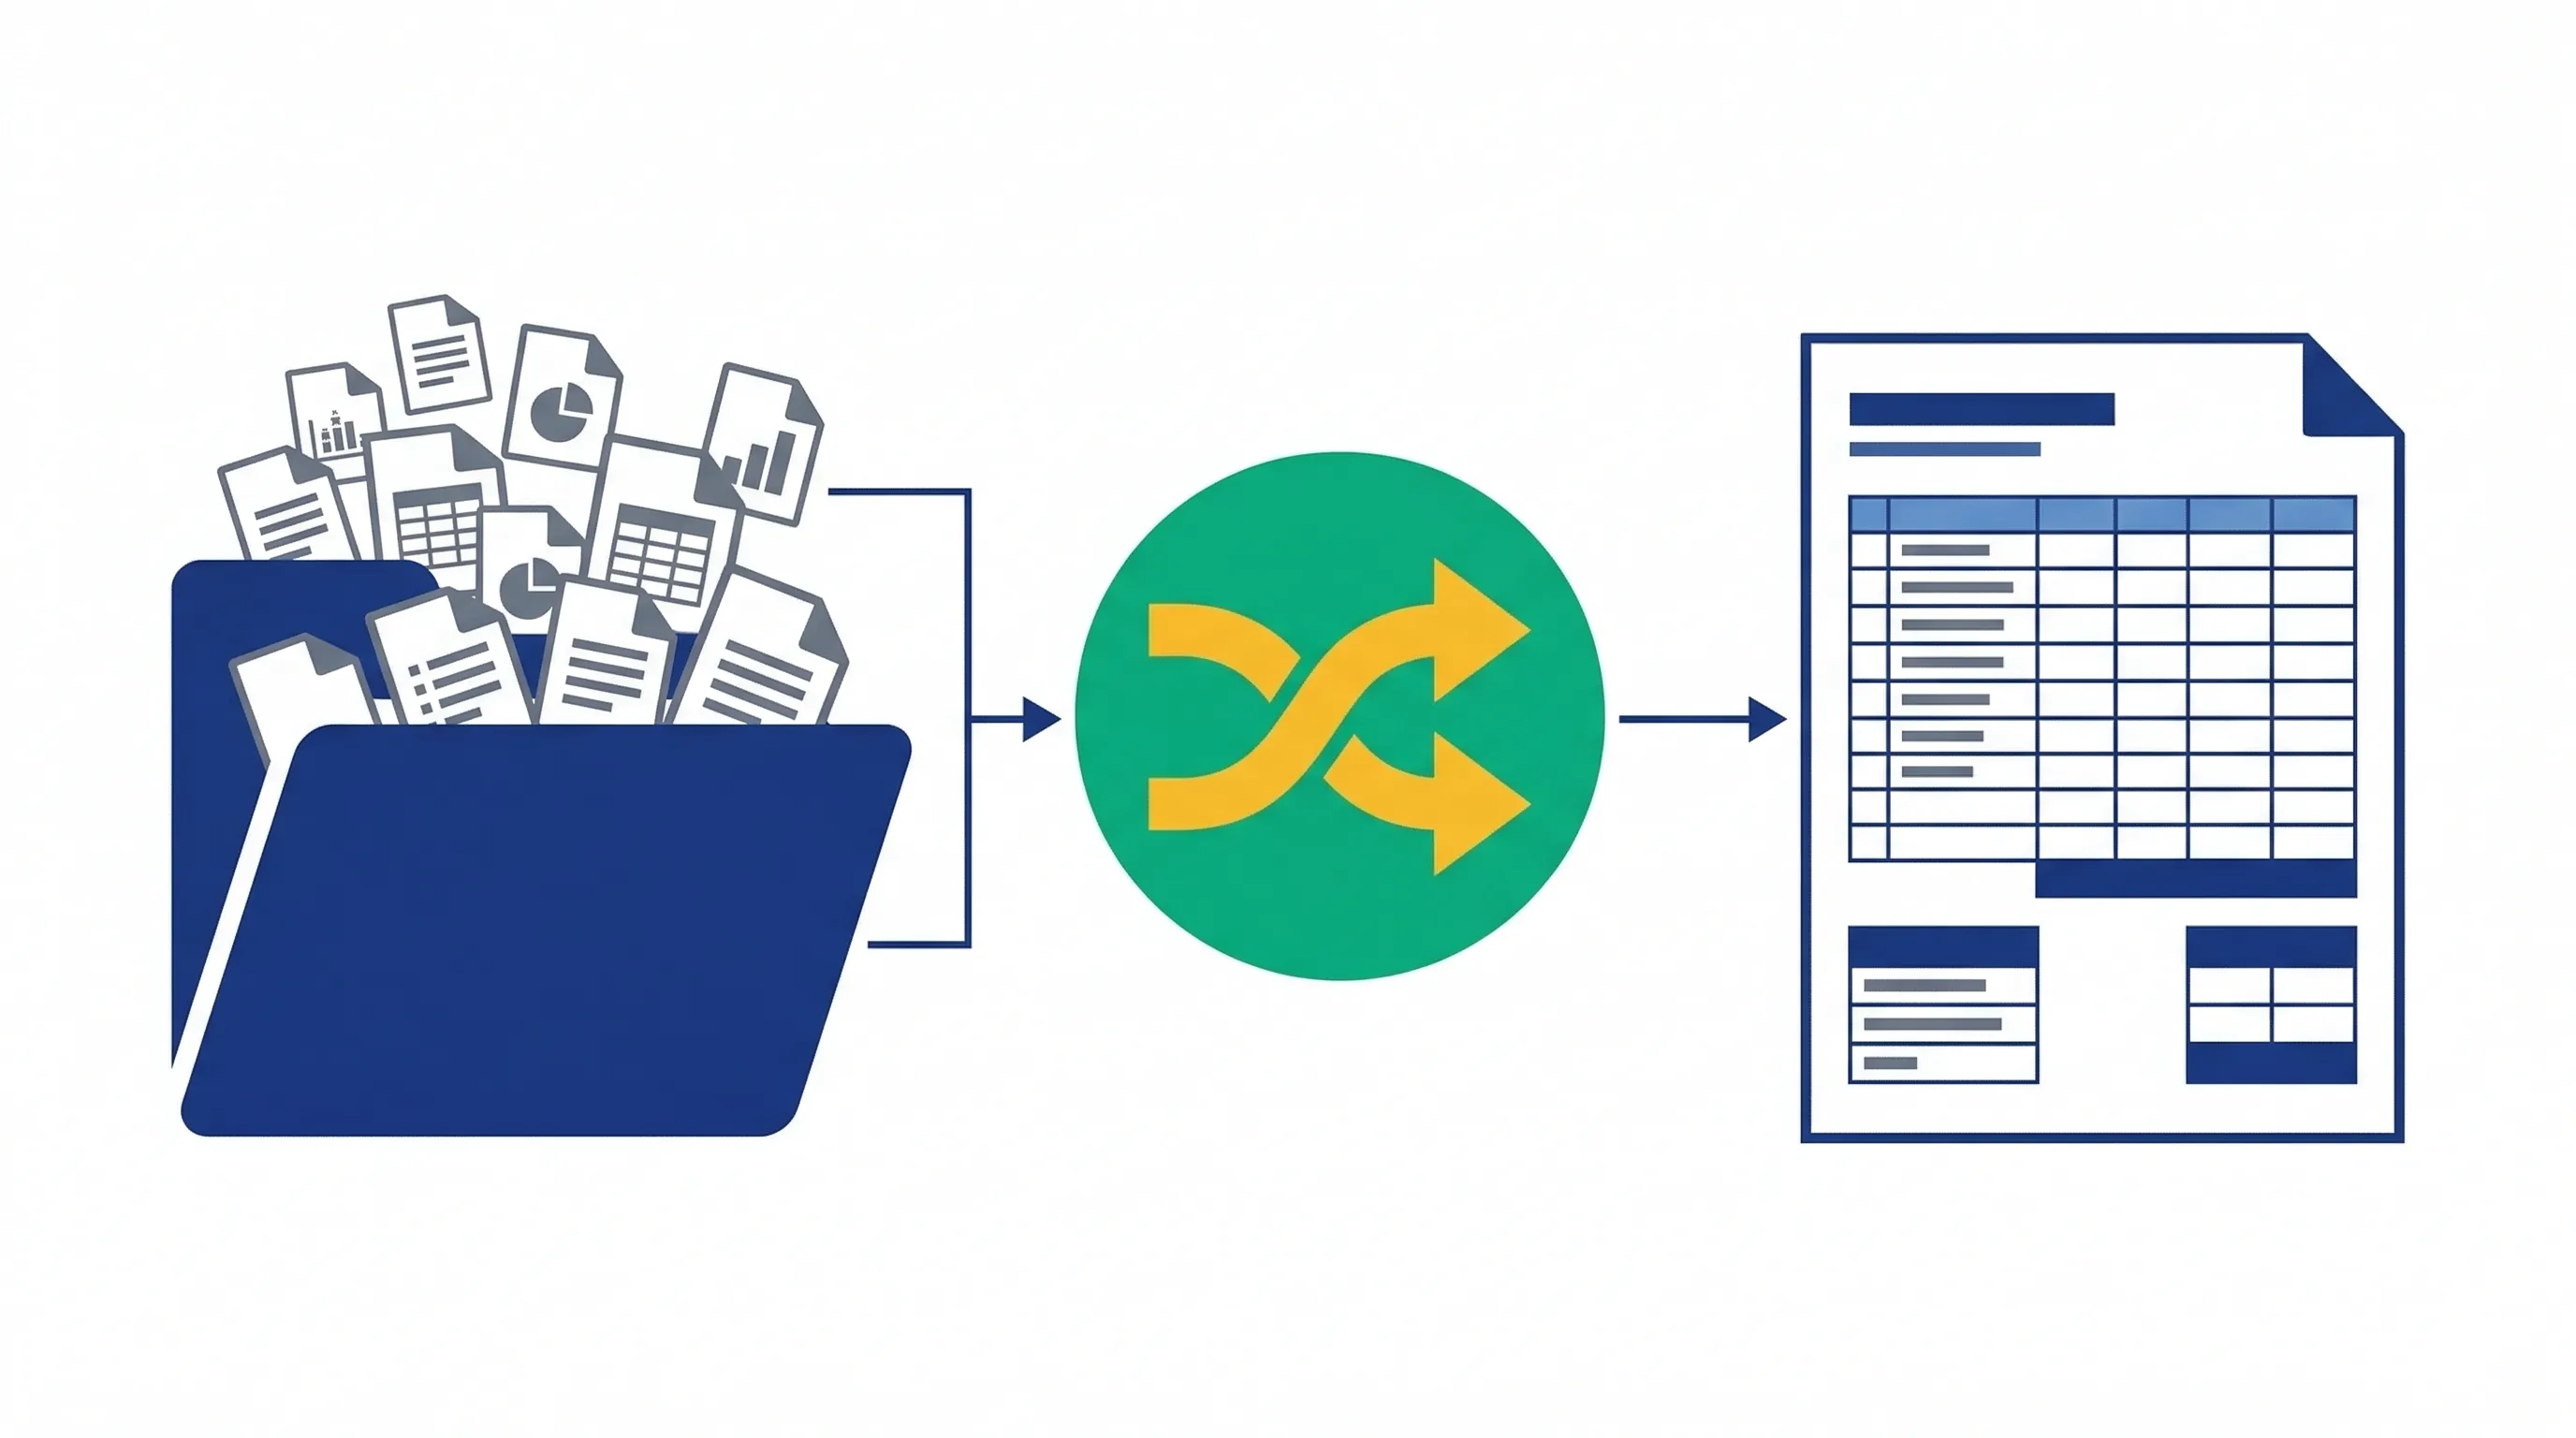
Power Query is Microsoft's built-in data transformation engine that turns repetitive data cleaning tasks into automated, one-click processes. Think of it as a recording device for your data cleanup steps — you show it once how to clean your messy bank export, and it remembers those exact steps forever. Next month, when you get a new bank statement, you simply click "Refresh" and Power Query applies all your cleaning steps automatically.
In this comprehensive guide, you'll discover what Power Query actually is, why it's revolutionizing financial reporting for small and medium businesses, and how you can start using it today — even if you've never written a formula more complex than SUM.
What is Power Query? The Simple Definition
Power Query is a data transformation and preparation engine built into Microsoft Excel. It is technically classified as an ETL tool (Extract, Transform, Load), but that jargon doesn't help most people understand what it actually does.
Here is the practical definition: Power Query is a tool that remembers how you clean your data, so you never have to do it manually again. According to Microsoft's official documentation, this approach can reduce data preparation time by up to 70% for typical business users.
The Restaurant Kitchen Analogy
Imagine you're a chef who receives raw ingredients every morning — your messy data exports. Every day, you perform the same tasks: wash the vegetables, remove stems, chop everything to uniform sizes, and arrange them in prep containers.
Without Power Query, you're doing this manually every single morning. With Power Query, you teach a kitchen assistant (the software) your exact process once. From that day forward, the assistant does all the prep work automatically while you focus on cooking — on actually analysing your data.
What Makes Power Query Different
Unlike Excel formulas that live in cells, Power Query operates in a separate environment called the Power Query Editor. This editor has a graphical interface with buttons and menus — no coding required. Every action you take (removing columns, filtering rows, changing data types) is recorded as a "step" in a sequence.
These steps form a recipe that Power Query follows every time you refresh your data. The steps are attached to the data connection, not the specific file — so the same transformation works on January's bank statement, February's statement, and every future statement, as long as the file structure remains consistent.
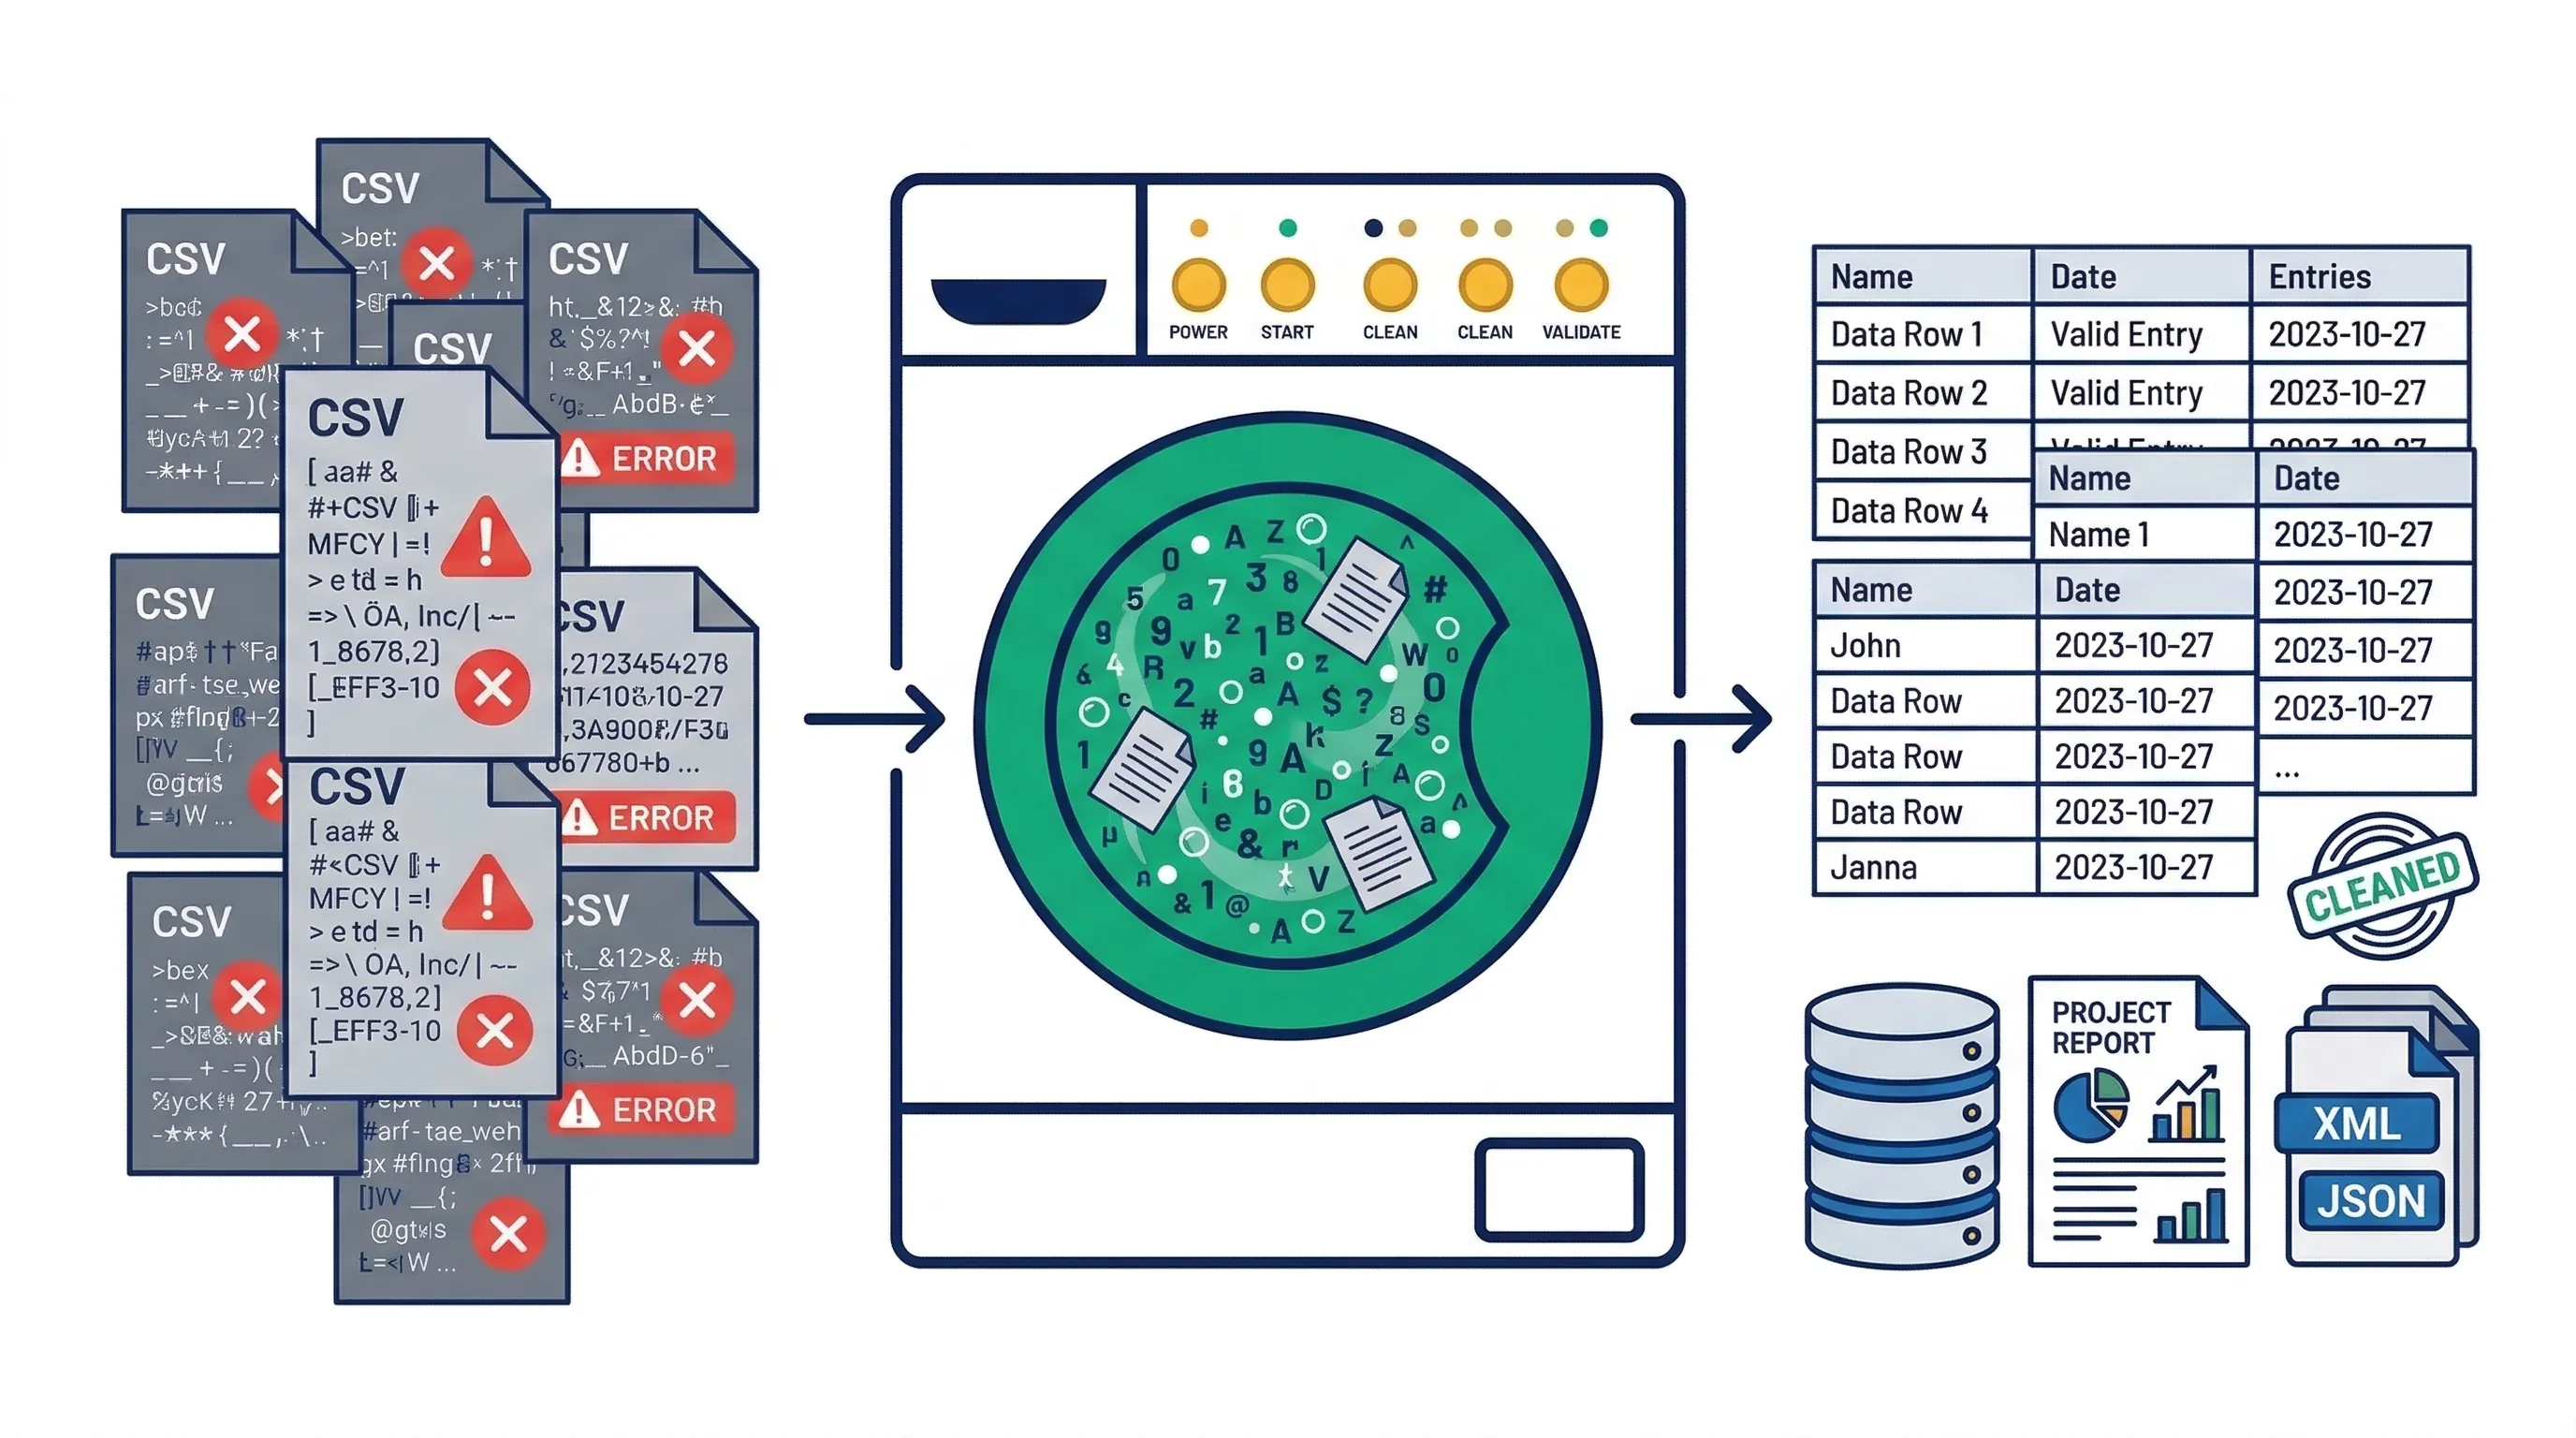
The washing machine analogy: throw in messy data, get clean results automatically
Why Financial Professionals Need Power Query
The "Data Janitor" Problem in Finance
A 2024 survey by the Corporate Finance Institute found that financial analysts spend an average of 12–15 hours per week on data preparation tasks. That's nearly 40% of a full-time workweek spent copying, pasting, and reformatting data instead of analysing it.
Common time-wasters include:
Downloading bank statements and reformatting them for reconciliation
Combining multiple Excel files from different departments
Cleaning up exports from accounting software (QuickBooks, Xero, Sage)
Removing header rows and footer totals from reports
Converting wide-format budget reports into pivot-table-friendly formats
Matching vendor names across different systems
Power Query eliminates the repetition. You set up the cleaning process once, and it runs automatically every time you receive new data.
The Business Case: Time Savings That Matter
Let's look at a real scenario: Your company processes payroll bi-weekly. Each pay period, you:
- Export payroll data from your HR system (5 minutes)
- Open the CSV file and delete the first 3 header rows (2 minutes)
- Remove the "Total" row at the bottom (1 minute)
- Split the "Full Name" column into "First Name" and "Last Name" (5 minutes)
- Change date formats from MM/DD/YYYY to your company standard (3 minutes)
- Calculate gross-to-net percentages (5 minutes)
- Copy the cleaned data into your master tracking file (3 minutes)
Total time: 24 minutes per pay period, or 10.4 hours per year.
With Power Query, steps 2–7 happen automatically in under 10 seconds. You save 10+ hours annually on just this one task. Multiply that across all your recurring reports, and the time savings become substantial.
Power Query vs. Traditional Excel: The Real Difference
The Fundamental Mindset Shift
Traditional Excel users think in cells. You reference A1, B12, C99. You write formulas like =IF(A2="US", B2*1.1, B2) and drag them down hundreds of rows.
Power Query thinks in columns and tables. You don't reference individual cells. Instead, you say: "Filter the entire 'Country' column to show only 'US'. Then multiply every value in the 'Price' column by 1.1."
This distinction matters enormously for scalability. Cell-based formulas slow down dramatically as datasets grow. A workbook with 100,000 rows of formulas can take minutes to recalculate. Power Query handles the same transformation in seconds because it's designed for large-scale data processing.
| Feature | Traditional Excel | Power Query |
|---|---|---|
| Data Reference | Individual cells (A1, B2) | Entire columns by name |
| Repeatability | Manual copy-paste each time | Automatic refresh |
| Undo Capability | Limited (Ctrl+Z) | Infinite (delete any step) |
| Data Source | Manual file opening | Connects to folders, databases, web |
| Performance | Slows with large datasets | Optimised for millions of rows |
| Documentation | None (formulas are cryptic) | Self-documenting step list |
| Error Handling | #REF!, #VALUE! errors | Clear error messages with context |
When to Use Each Tool
Use Traditional Excel When:
- →You're doing a one-time analysis on a small dataset (under 1,000 rows)
- →You need complex calculations that reference multiple worksheets
- →You're creating financial models with scenario analysis
Use Power Query When:
- ✓You receive the same messy data file regularly (weekly, monthly, quarterly)
- ✓You need to combine multiple files from a folder
- ✓Your data source is external (databases, web pages, SharePoint)
- ✓You're cleaning data before analysis
- ✓You want to document your data preparation process
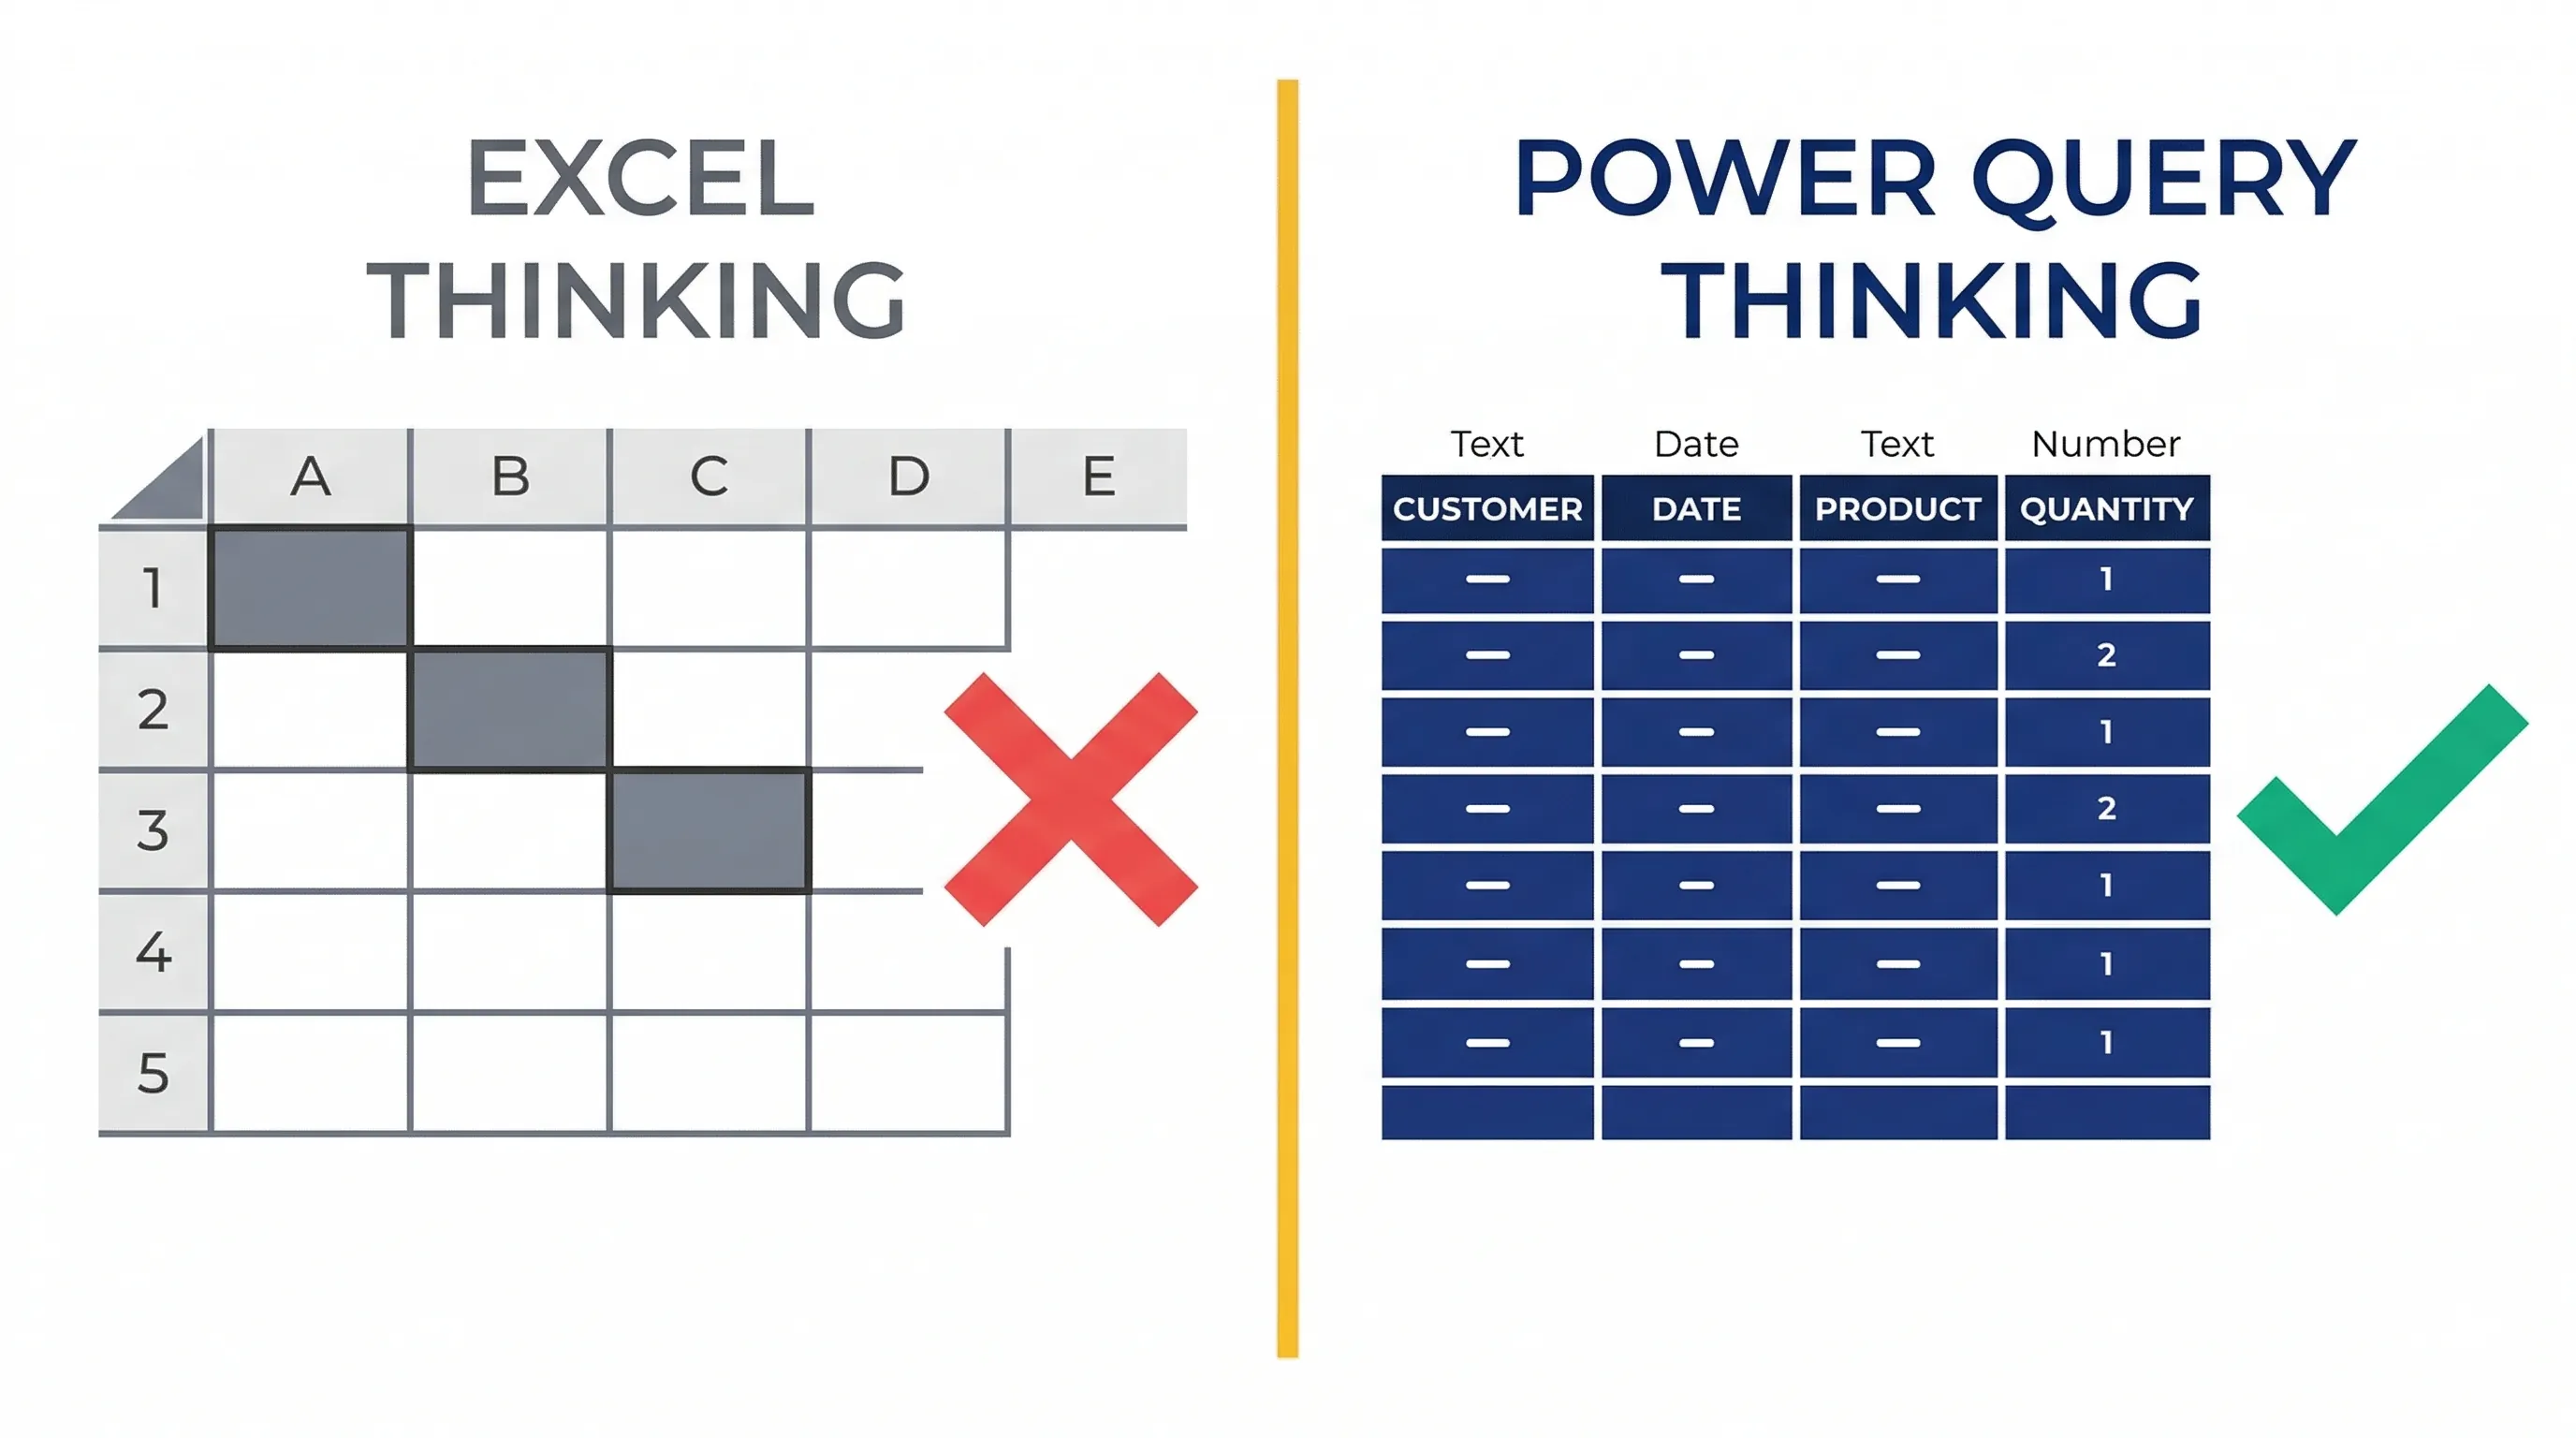
The mental shift: from individual cells to entire columns
How Power Query Works: The ETL Process Explained
Understanding ETL Without the Jargon
ETL stands for Extract, Transform, Load — the three phases of data processing. Let's break down what each phase means in practical terms:
1. Extract (Getting Your Data)
This is where you tell Power Query where your data lives. It could be:
- An Excel file on your computer
- A folder containing multiple CSV files
- A database (SQL Server, Access)
- A web page with tables
- Cloud storage (SharePoint, OneDrive)
- Your accounting software's API
Power Query connects to the source and reads the data without modifying the original file. Your source data remains completely untouched.
2. Transform (Cleaning Your Data)
This is where the magic happens. In the Power Query Editor, you perform cleaning operations using buttons and menus:
- Remove unnecessary columns
- Filter out blank rows
- Change data types (text to numbers, text to dates)
- Split columns (separate "First Last" into two columns)
- Merge columns (combine "Street" and "City" into one address)
- Replace values (change "N/A" to 0)
- Unpivot columns (convert wide tables to tall tables)
- Remove duplicates
- Group and aggregate data
Every action you take is recorded as a step. You can see the complete list of steps in the "Applied Steps" pane, and you can delete, reorder, or modify any step at any time.
3. Load (Bringing Clean Data Back to Excel)
Once your data is clean, Power Query loads it into an Excel table. This table is connected to your Power Query transformation. Whenever your source data updates, you click "Refresh" and Power Query re-runs all your transformation steps automatically.
The Power of Recorded Steps
Here's what makes Power Query revolutionary: the steps are attached to the data connection, not the specific file. If you set up a Power Query transformation for January's bank statement, that same transformation works perfectly on February's bank statement, March's statement, and every future statement — as long as the file structure remains consistent.
This is fundamentally different from Excel formulas, which break if you insert a column or change a file name.
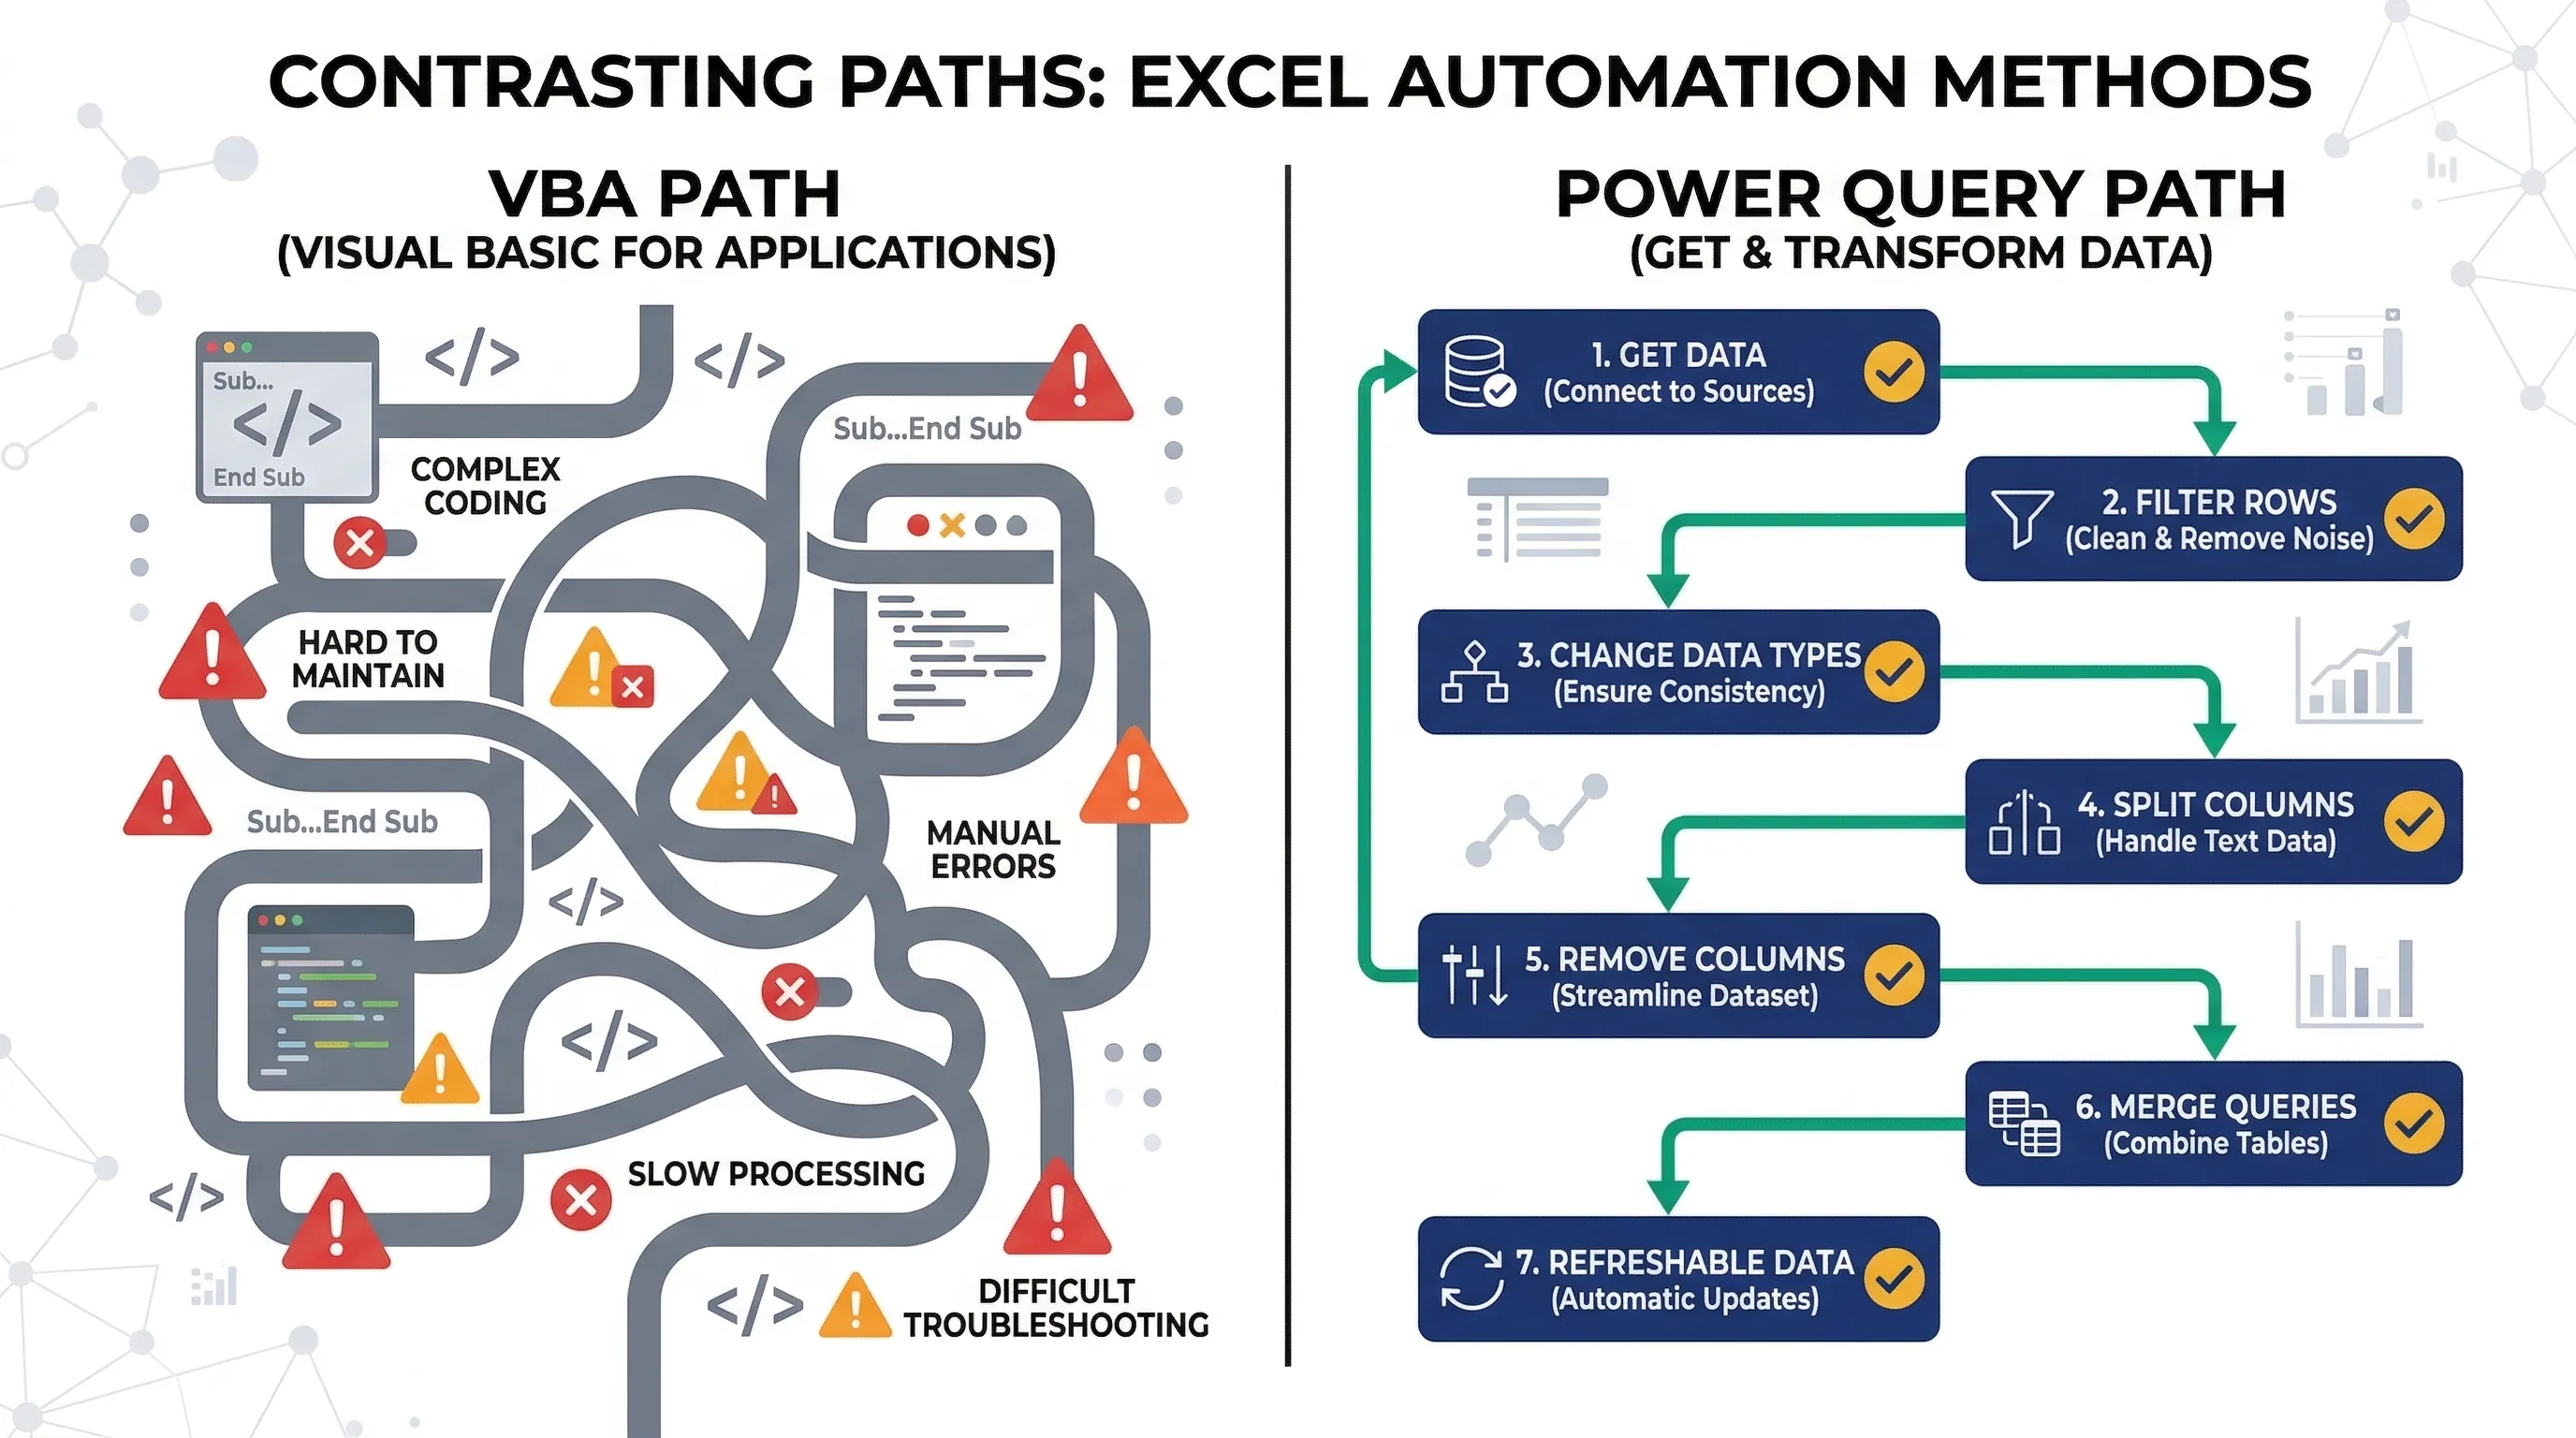
Power Query's visual approach vs VBA's code-based complexity
Real-World Financial Use Cases
Use Case 1: Automated Bank Reconciliation
The Challenge: Your company has 3 bank accounts. Each month, you download statements from each bank's website. The files have different formats — Bank A puts transaction dates in column A, Bank B puts them in column C. Bank A uses "Debit/Credit" columns, Bank B uses positive/negative numbers.
The Manual Process: You spend 45 minutes each month opening each file, reformatting columns, standardizing the layout, and combining everything into one master reconciliation file.
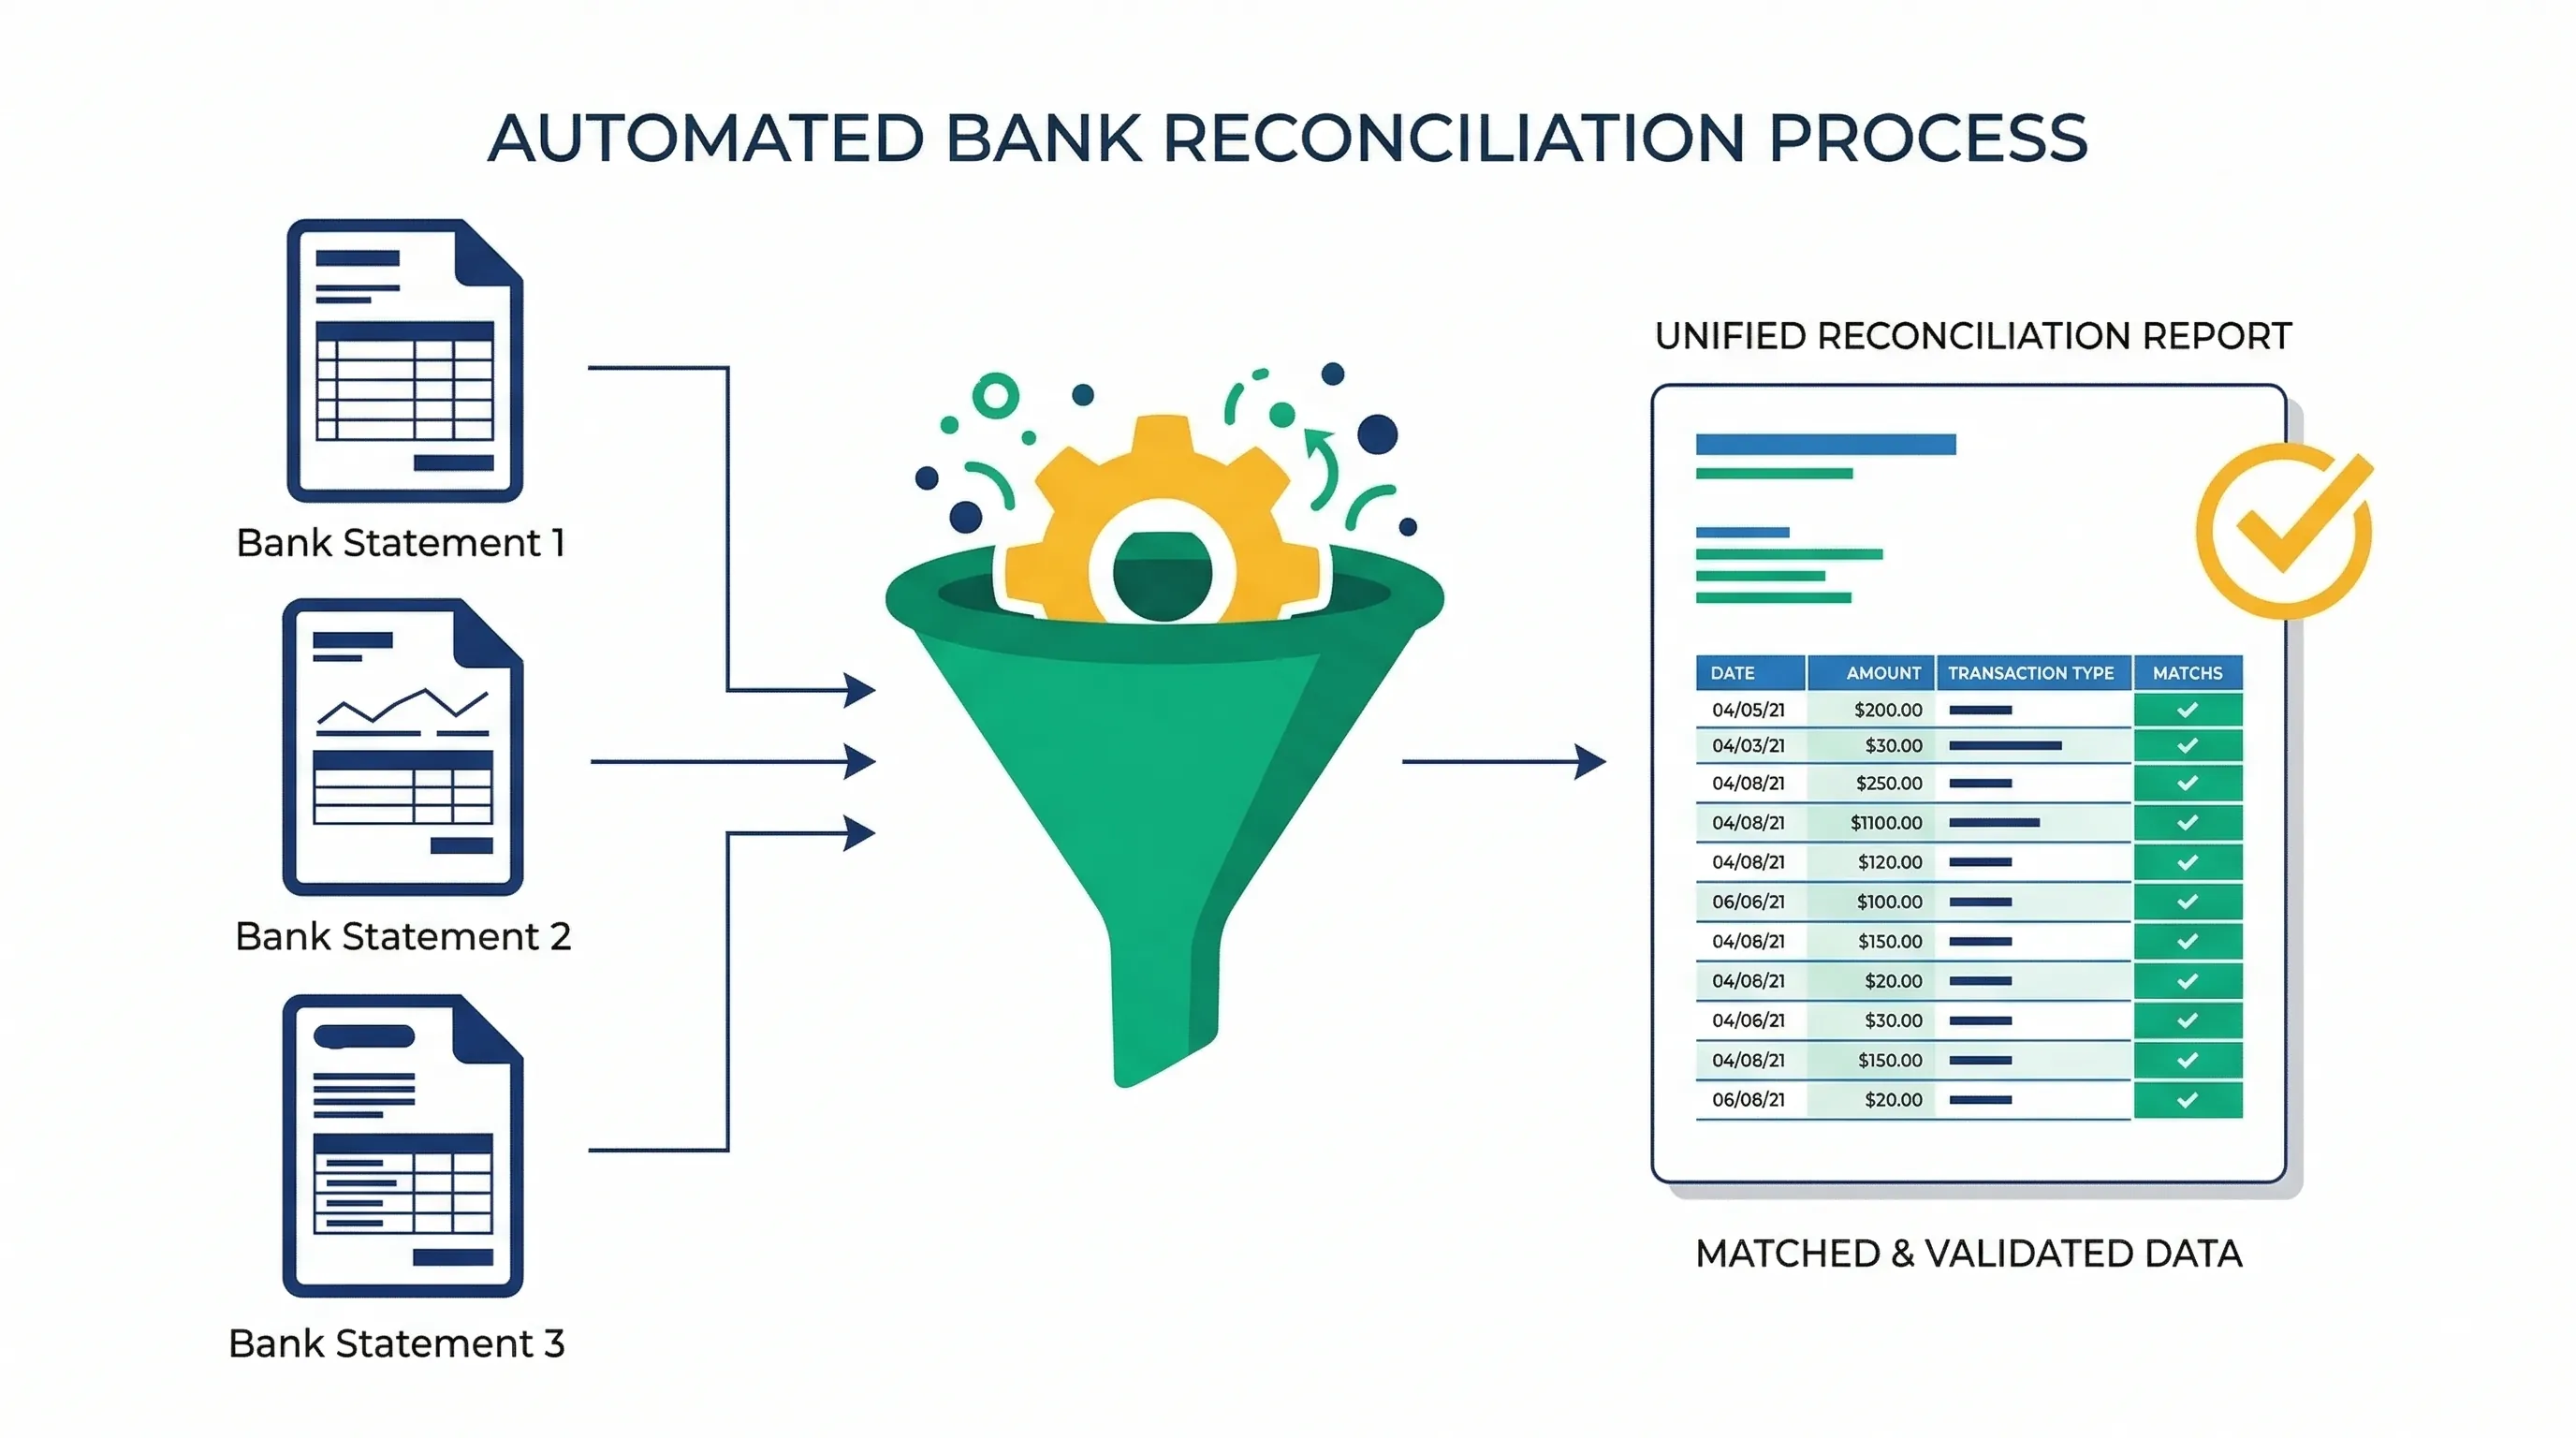
Bank reconciliation: automatically combining statements from multiple banks
The Power Query Solution:
- Create a Power Query connection to the folder where you save bank statements
- Set up transformation steps to standardize each bank's format
- Combine all three banks into one unified table
- Add a calculated column for running balance
- Load the clean data into Excel
Time Investment: 30 minutes to set up once.
Monthly Time Savings: 40 minutes (you only spend 5 minutes downloading files and clicking Refresh).
Annual Savings: 8 hours.
Learn more about transforming messy financial data here
Use Case 2: Multi-Department Budget Consolidation
The Challenge: You manage budgets for 8 departments. Each department head sends you their monthly actuals in an Excel file. The files have the same structure, but you need to combine them and add a "Department" column to track which expenses belong to whom.
The Manual Process: Open each file, copy the data, paste into your master file, manually type the department name in a new column. Repeat 8 times. Total time: 25 minutes monthly.
The Power Query Solution:
- Ask department heads to save their files in a shared folder
- Create a "From Folder" connection in Power Query
- Power Query automatically combines all 8 files
- Extract the department name from each filename
- Add it as a column in your consolidated table
The From Folder feature automatically consolidates multiple files
Result: When department heads update their files, you click Refresh and see the updated consolidated budget instantly.
Use Case 3: Payroll Reconciliation Across Systems
The Challenge: Your payroll comes from an HR system, but you need to reconcile it against general ledger entries in your accounting software. The employee IDs don't match perfectly — HR uses "EMP001" while accounting uses "E-001".
The Manual Process: Export both files, manually match employees by name (prone to errors with similar names), flag discrepancies. Time: 90 minutes bi-weekly.
The Power Query Solution:
- Connect to both data sources
- Use Power Query's "Fuzzy Matching" feature when merging tables
- Set a similarity threshold (e.g., 85% match)
- Power Query intelligently matches "EMP001" with "E-001" and "John Smith" with "John A. Smith"
- Automatically flag unmatched records for manual review
Time Savings: Reduces reconciliation time from 90 minutes to 20 minutes.
Use Case 4: Monthly Financial Reporting Package
The Challenge: You produce a 15-page monthly financial report that pulls data from 6 different sources: sales database, expense tracking spreadsheet, inventory system, bank statements, accounts receivable aging, and accounts payable aging.
The Manual Process: Each month, you spend 4–5 hours gathering data, reformatting it, updating formulas, and fixing broken links.
The Power Query Solution:
- Create Power Query connections to all 6 data sources
- Build transformation steps for each source
- Load clean data into separate Excel tables
- Build your report using pivot tables and formulas that reference these tables
- Each month, click "Refresh All" and your entire report updates in 2 minutes
Time Savings: Reduces report preparation from 5 hours to 30 minutes monthly.
Getting Started: Is Power Query Available on Your Computer?
Checking Your Excel Version
Power Query is built into most modern versions of Excel, but the name and location vary:
Power Query is built-in and called "Get & Transform Data". Find it on the Data tab of the ribbon. Look for buttons like "Get Data," "From Table/Range," "From Text/CSV".
Power Query is available in Excel 2016 for Mac and later. The interface is slightly different but functionality is the same.
Limited Power Query functionality. You can refresh existing queries but can't create new ones.
System Requirements
Power Query works on any Windows PC running Excel 2010 or later. There are no special hardware requirements, though more RAM helps when processing large datasets (4GB minimum, 8GB+ recommended for files over 100,000 rows).
Finding the Power Query Interface
- Open Excel
- Click the Data tab on the ribbon
- Look for the "Get & Transform Data" section
- Click "Get Data" → "From File" → "From Workbook" to start your first query
If you don't see these options, you're either using an older Excel version or need to enable the Power Query add-in through File → Options → Add-ins.
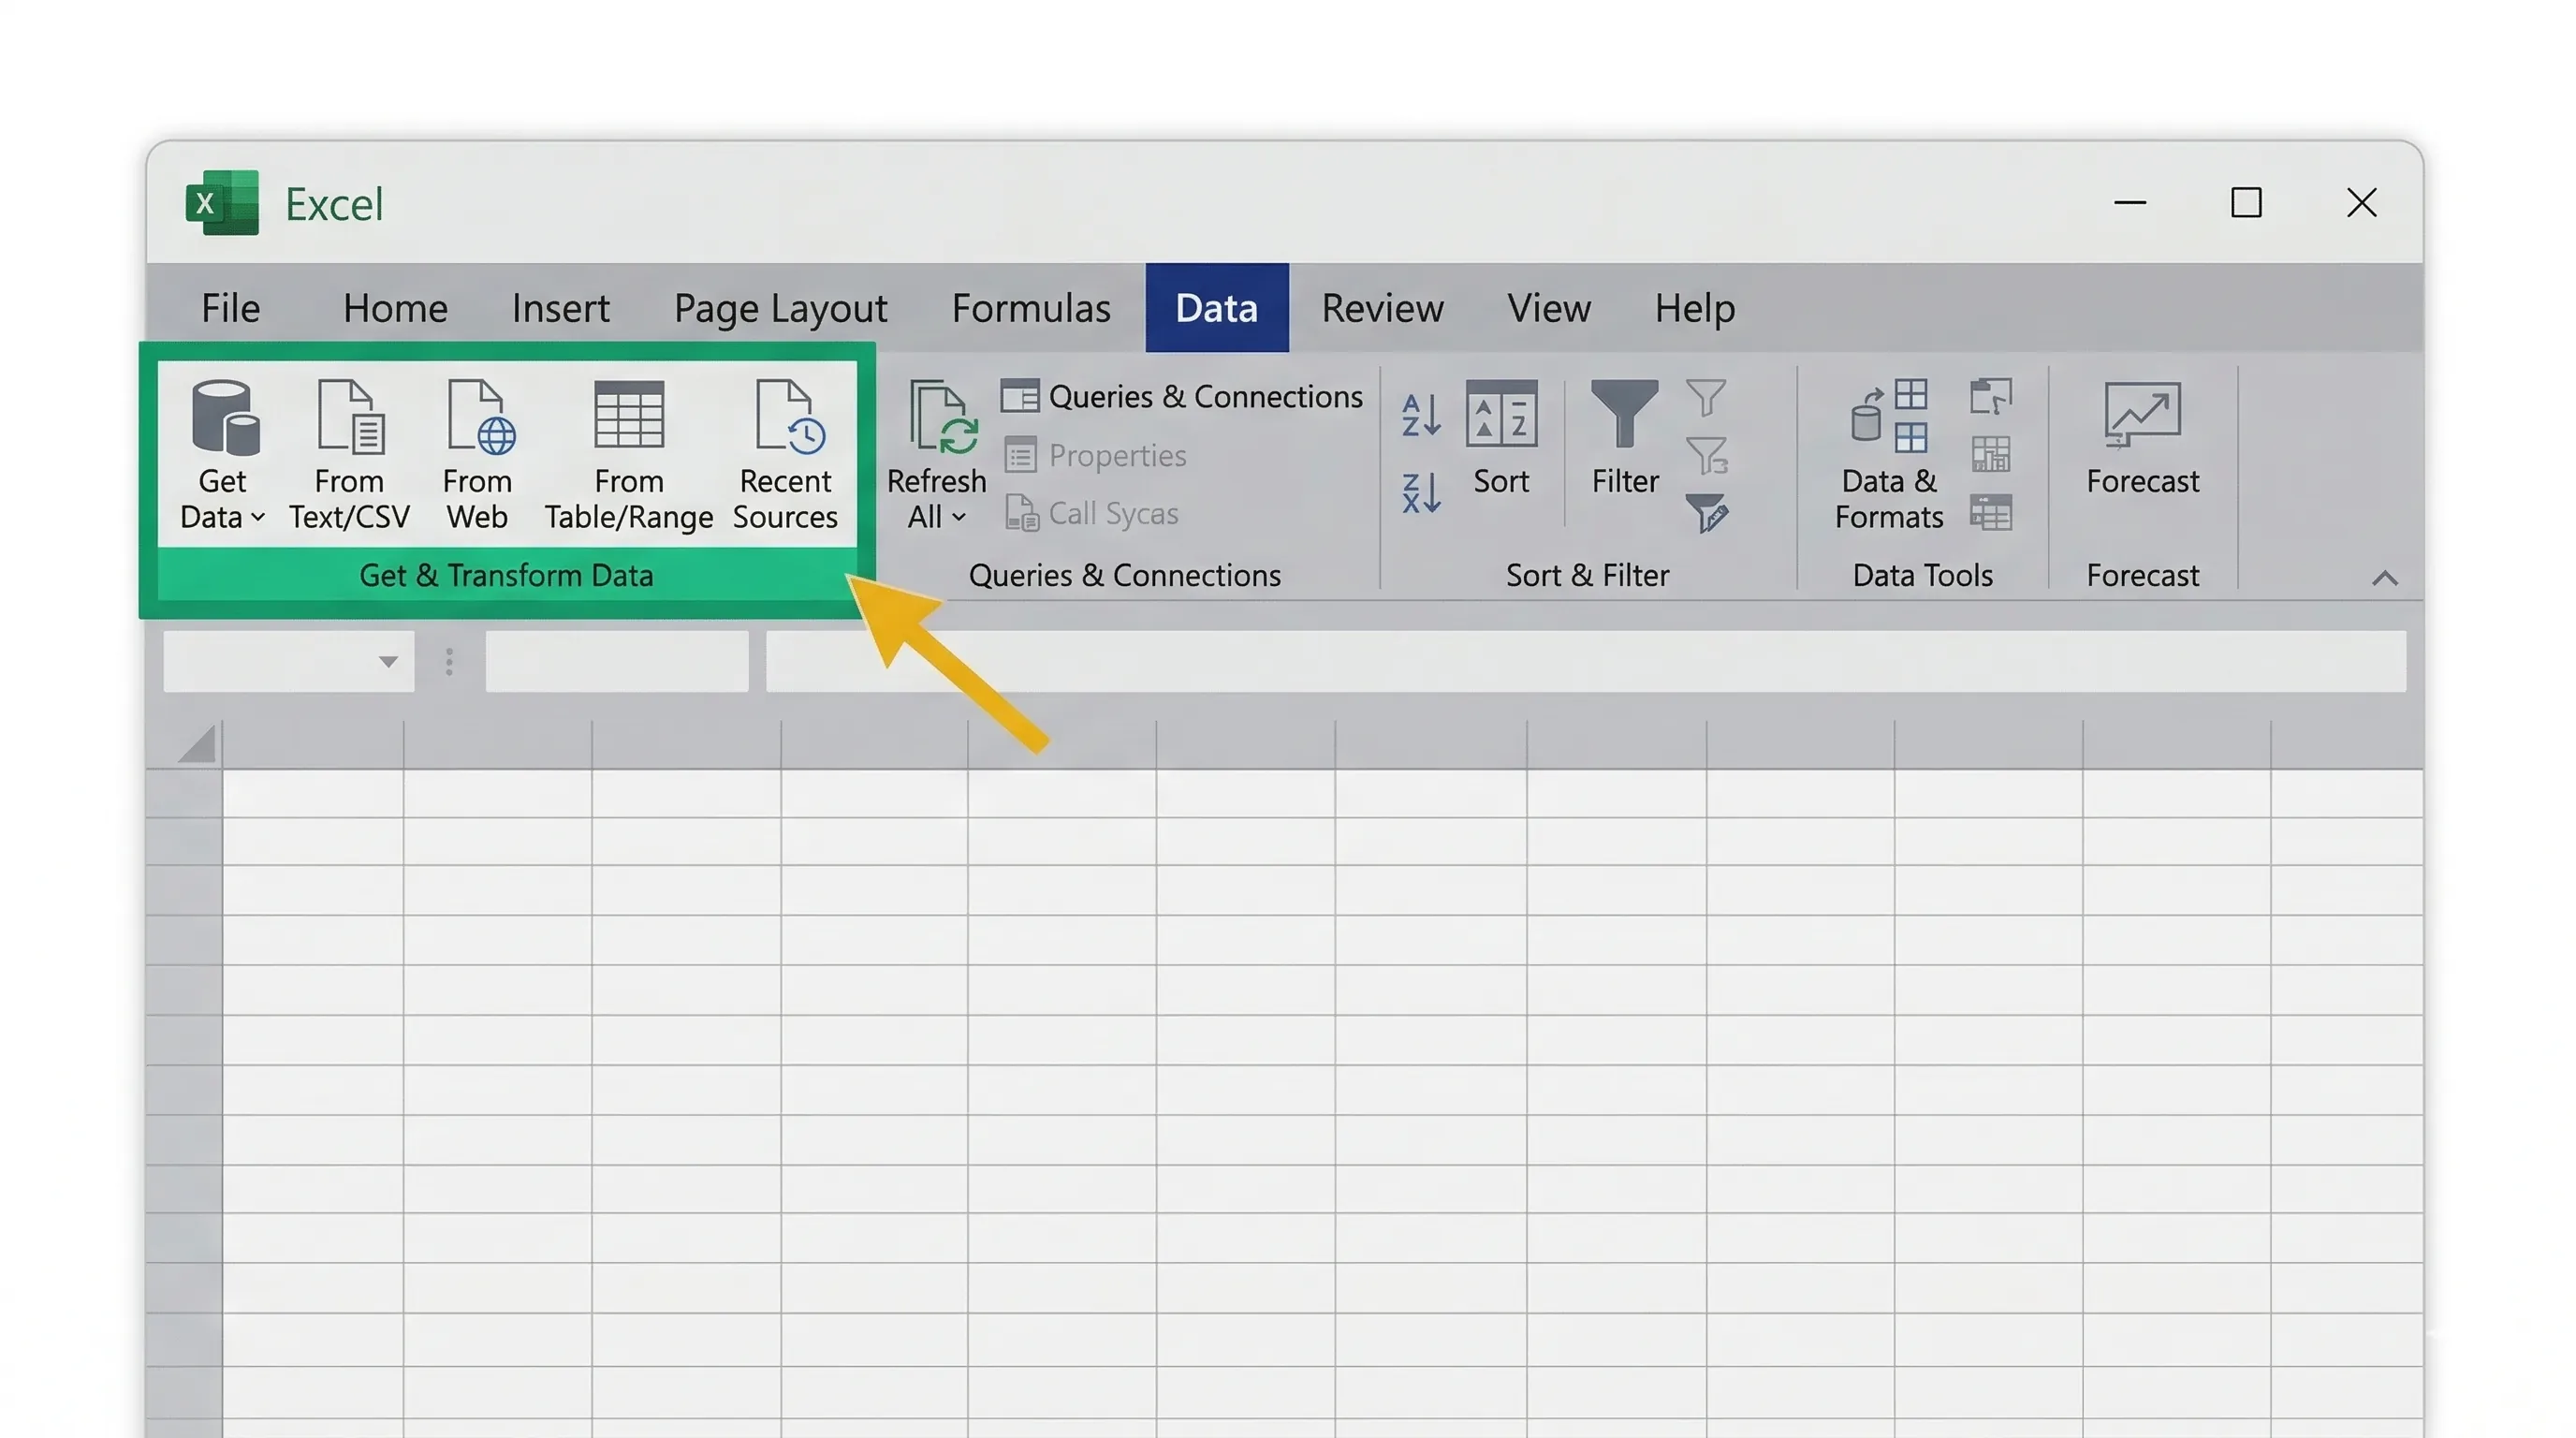
Locate Power Query in Excel: Data tab → Get & Transform Data section
Power Query for Accounting: Practical Applications
Application 1: Chart of Accounts Mapping
Many accounting teams need to map transactions from subsidiary systems to their main chart of accounts. Power Query's merge functionality makes this trivial:
- Create a reference table with old account codes and new account codes
- Import your transaction data
- Use Power Query's "Merge" feature to look up the correct account code
- Handle unmatched codes with conditional logic
This replaces hundreds of nested IF statements or VLOOKUP formulas that slow down your workbook.
Application 2: Intercompany Eliminations
For companies with multiple entities, intercompany eliminations are tedious. Power Query can:
- Identify matching intercompany transactions across entities
- Flag discrepancies where amounts don't match
- Automatically create elimination entries
- Generate exception reports for manual review
Application 3: Fixed Asset Depreciation Schedules
If you maintain fixed asset registers in Excel, Power Query can:
- Import asset purchases from your accounting system
- Calculate depreciation using custom formulas
- Update monthly without manual intervention
- Handle asset disposals and adjustments
Application 4: Sales Tax Reconciliation
For businesses dealing with multiple tax jurisdictions:
- Import sales data with tax amounts
- Group by tax jurisdiction and rate
- Compare calculated tax to collected tax
- Identify discrepancies for investigation
Application 5: Expense Report Consolidation
When employees submit expense reports in various formats:
- Connect to a shared folder where reports are saved
- Standardize different formats (some use "Date," others use "Transaction Date")
- Validate expense categories against approved lists
- Flag policy violations (meals over $50, missing receipts)
- Consolidate into one master file for approval
Common Mistakes Finance Teams Make with Power Query
New users often try to reference specific cells or rows in Power Query. This doesn't work. Power Query operates on entire columns. If you need to reference a specific value, you need to filter the table first, then extract the value.
Excel is forgiving with data types — it often guesses correctly. Power Query is strict. If a column is marked as "Text," you can't perform mathematical operations on it. Always check and set correct data types in your first transformation step: Dates should be Date type, Numbers should be Decimal or Whole Number type, Account codes should be Text type (even if they look like numbers).
Power Query auto-generates step names like "Changed Type" and "Removed Columns." Six months later, you won't remember what you did. Rename steps immediately to descriptive names like "Remove Header Rows" or "Convert Date Format to MM/DD/YYYY."
If you reference a specific file like C:\Users\John\Desktop\January_Sales.xlsx, your query breaks when you move the file or share the workbook with a colleague. Instead: Use relative paths when possible, Connect to folders rather than individual files, Store source files in shared locations (SharePoint, network drives).
Not every data task needs Power Query. For one-time cleanups on small datasets, traditional Excel methods might be faster. Use Power Query when you need repeatability — when you'll perform the same transformation multiple times.
Power Query doesn't automatically update when source data changes. You must manually click "Refresh" or set up automatic refresh schedules. Many users forget this and wonder why their reports show old data.
Power Query can handle millions of rows, but loading all that data into Excel can crash your workbook. Best practice: filter and aggregate in Power Query, then load only the summarized data to Excel.
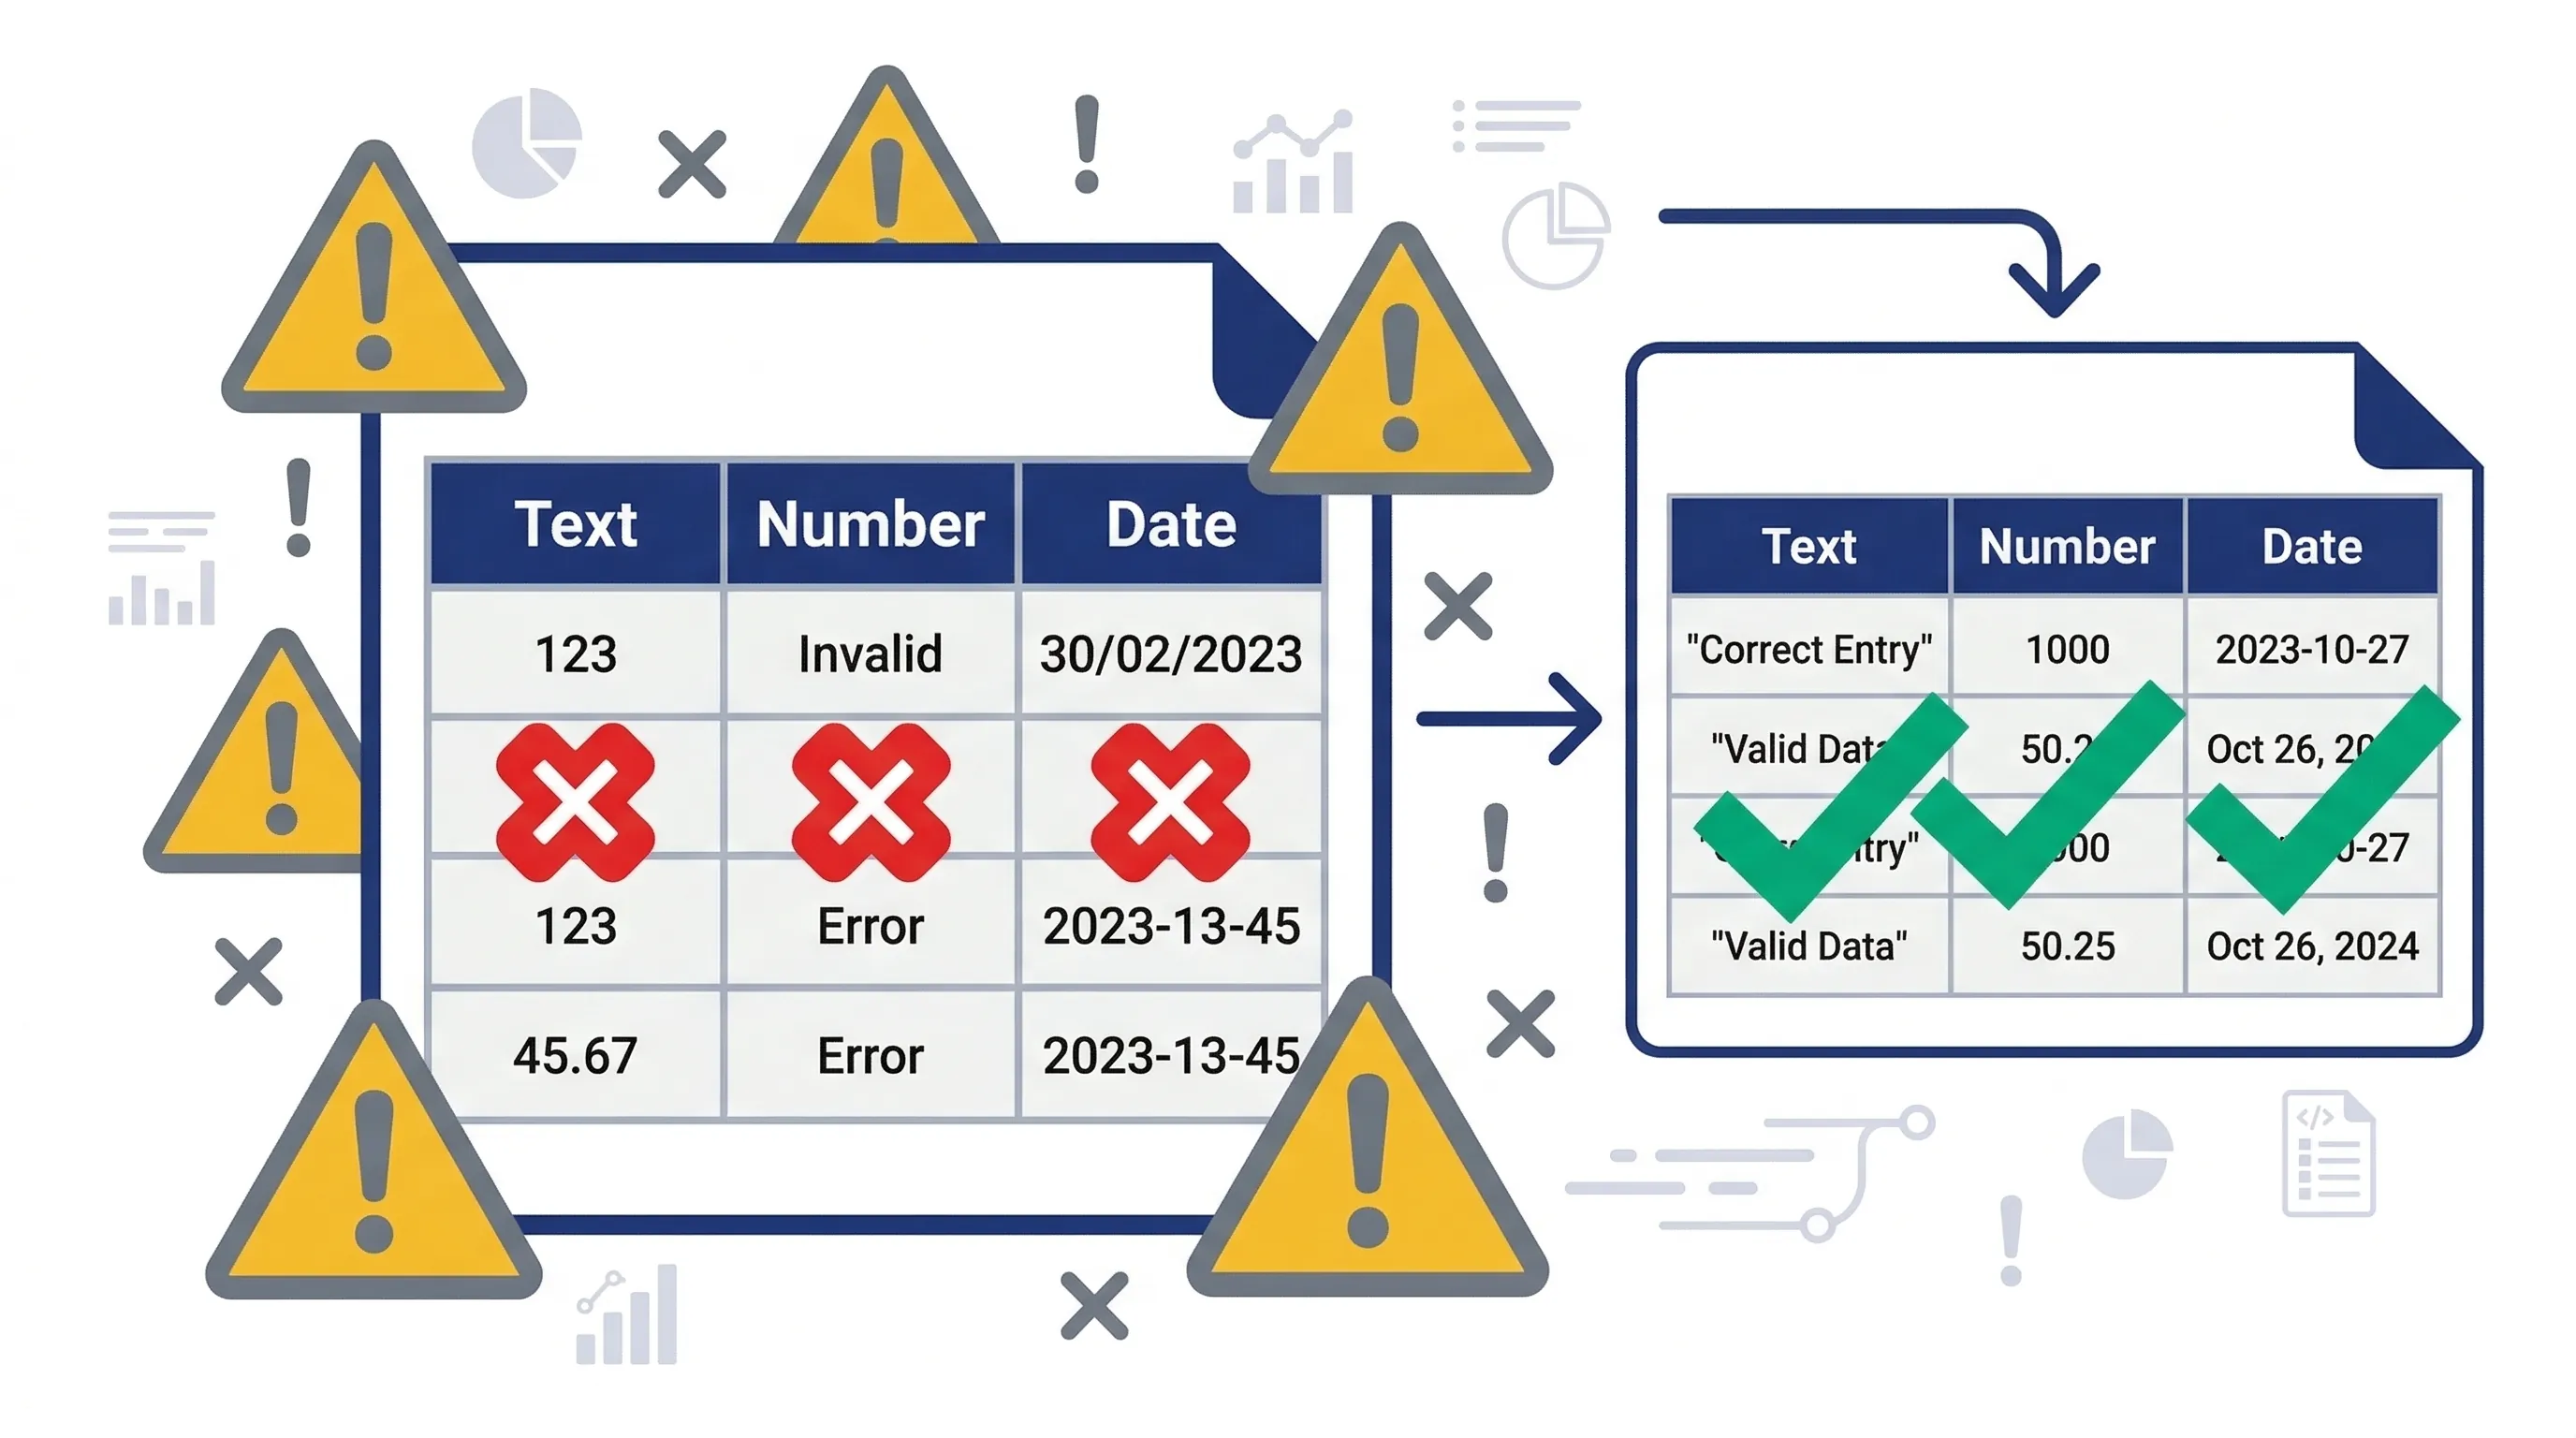
Watch out for data type mismatches — they're the #1 source of Power Query errors
Power Query vs. Alternatives: What Else Is Out There?
- +Best for calculations, financial modelling, scenario analysis
- −Slow with large datasets
- −Break easily
- −Hard to maintain
- +Best for data cleaning, combining files, reshaping data
- −Not designed for complex calculations across worksheets
- +Extremely flexible
- +Can automate any Excel task
- −Requires programming knowledge
- −Breaks easily when file structure changes
- −Hard to maintain
- +No coding required
- +Resilient to file structure changes
- +Self-documenting
- −Limited to data transformation tasks
- +More powerful
- +Handles any data size
- +Integrates with machine learning
- −Steep learning curve
- −Requires Python installation
- −Not integrated with Excel
- +Built into Excel
- +No installation needed
- +Visual interface
- −Limited to Excel's capabilities
- −Not suitable for advanced analytics
- +Uses the exact same Power Query engine
- +Better for creating dashboards and visualizations
- +Designed for sharing reports with stakeholders
- −Requires separate software (free desktop version available)
- +Same transformation capabilities
- +Better for detailed financial analysis
- +Easier to share (everyone has Excel)
- +Integrates with existing Excel workflows
Frequently Asked Questions
Is Power Query difficult to learn?
No. If you can use Excel's ribbon interface — clicking buttons and menus — you can use Power Query. The learning curve is much gentler than learning VBA or Python. Most finance professionals become productive with Power Query within 2–3 hours of practice.
Will Power Query break my original data files?
No. Power Query is read-only on source files. It reads your data, transforms it in memory, and outputs a new table. Your original bank statement, payroll export, or accounting report remains completely untouched.
Do I need to learn M code?
The background language is called M. However, 95% of users never write M code manually. The ribbon buttons generate M code automatically — similar to how you don't need to know HTML to use Microsoft Word. Advanced users can edit M code for complex scenarios, but it's not required for typical financial reporting tasks.
Can Power Query connect to QuickBooks, Xero, or Sage?
Yes, but it depends on your accounting software's capabilities: QuickBooks Online has a built-in connector (requires API access). QuickBooks Desktop, Xero, and Sage typically require CSV export — save exports to a folder, then connect Power Query to that folder using the "From Folder" feature.
Does Power Query work with SharePoint and OneDrive?
Yes. You can connect to Excel files stored in SharePoint or OneDrive using the "SharePoint Folder" or "Web" connector. Multiple people can update source files, and anyone with the Power Query workbook can refresh to see the latest data.
How much does Power Query cost?
Power Query is completely free. If you have Excel 2016 or later (including Microsoft 365), it's built-in at no extra cost. For Excel 2010/2013, it's available as a free add-in from Microsoft's website.
Can Power Query handle my 500,000-row dataset?
Yes. Power Query is designed for large datasets and can handle millions of rows efficiently. Best practice: filter and aggregate in Power Query, then load only the summarised data to Excel (which has a 1,048,576 row limit).
What happens if my source file format changes?
You simply edit your Power Query steps to accommodate the change. The fix takes 2–3 minutes, and all future refreshes work correctly — unlike Excel formulas, which require updating hundreds of cell references.
Can I share my Power Query workbook with colleagues?
Yes, but with considerations: If source files are on your local computer, colleagues need access to the same file path. Best practice: store source files in shared locations (SharePoint, network drives). The Power Query steps are embedded in the Excel workbook, so colleagues can refresh without rebuilding the queries.
Is Power Query secure for sensitive financial data?
Yes. Power Query operates locally on your computer. Data isn't sent to external servers (unless you're connecting to cloud sources like SharePoint). For highly sensitive data, ensure source files are stored in secure, access-controlled locations.
Next Steps: Start Your Power Query Journey Today
You now understand what Power Query is, why it's transforming financial reporting for small and medium businesses, and how it can save you hours every week on repetitive data tasks.
Here's your action plan to get started: