
Compare Two Excel Sheets for Differences, Without VLOOKUP or an Add-in
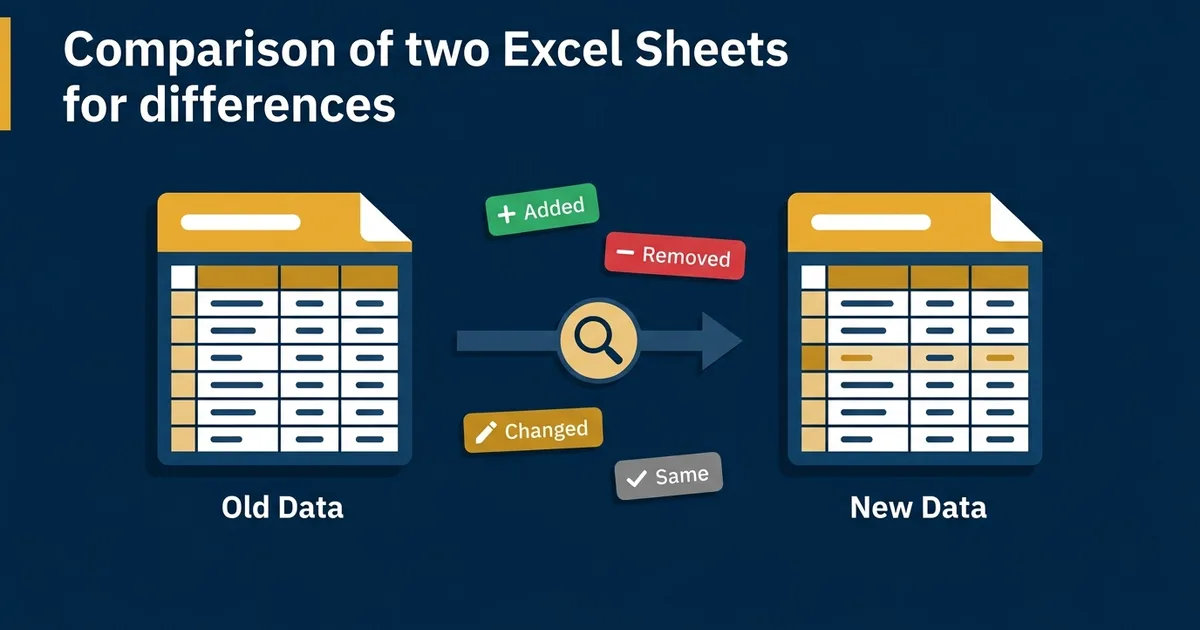
Short answer: to compare two Excel sheets for differences without installing anything, load both datasets into a macro-enabled workbook that matches rows by a unique key, not by cell position, then classifies each row as Added, Removed, Changed, or Same and highlights the exact cell that moved. That is what ExceptionGuard does, and it is the method this post walks through.
If you have ever compared two versions of the same spreadsheet, last month's payroll against this month's, last quarter's chart of accounts against this quarter's, you already know the problem. VLOOKUP tells you that something changed. It rarely tells you exactly what changed, and it never tells you who reviewed it.
This is exactly the gap ExceptionGuard was built to close. It takes two datasets, Old and New, and produces a classified, colour-coded, cell-level exception report in seconds, whether you are comparing payroll, HR records, vendor master data, or monthly expense reports. If you have used our original Compare Data Workbook before, ExceptionGuard is the direct upgrade.

ACA | FMVA® | 19 Years in Finance
Why a Simple VLOOKUP Isn't Enough
Most people compare two Excel datasets one of three ways: a manual VLOOKUP, conditional formatting, or scrolling through two windows side by side. Each has the same structural weaknesses.
Why is VLOOKUP not showing differences correctly
VLOOKUP and XLOOKUP are sensitive to hidden whitespace, text-formatted numbers, and column order. A trailing space in "Product A " versus "Product A" is enough to break the match. And a lookup formula only pulls the first match; it cannot isolate which specific column changed across a row. You end up with a formula that says "different" without saying where.
Why does adding or deleting a row break a cell-by-cell comparison
Formulas like =Sheet1!A1<>Sheet2!A1 compare by grid position, not by identity. Insert one row at the top of the new sheet and every formula below it now compares the wrong pair of rows, throwing false mismatches across the entire sheet. This is the single most common reason a "working" comparison formula suddenly looks broken: nothing broke, the rows just shifted.
Why conditional formatting stops working at scale
Conditional formatting rules applied across a range of more than roughly 5,000 rows start to cause visible lag, memory bloat, and in some cases application crashes. It was never built as a comparison engine, it is a formatting rule re-evaluated on every recalculation.
Why the built-in Spreadsheet Compare tool might not be on your ribbon
Excel does have a native comparison add-in called Spreadsheet Compare (formerly Inquire). It is genuinely useful. It is also restricted to Microsoft 365 Apps for Enterprise, Office Professional Plus, and E3/E5 licence tiers. If your organisation runs Business Standard, Business Premium, or a Home plan, the Inquire tab simply is not available, no matter how you search the ribbon.
None of these methods are wrong exactly. They are all fragile in a specific, predictable way: they tell you rows are different, not which cell changed, they do not scale past a few thousand rows without slowing down, and none of them leave a record. If someone asks "who checked this, and when," a formula has no answer.
What ExceptionGuard Actually Does
At its core, this is a compare data workbook: you load an "Old" dataset and a "New" dataset, click one button, and every row is automatically classified into one of four categories:
- Added — a new row that exists in the New data but not the Old data
- Removed — a row that existed before but is missing from the New data
- Changed — a row that exists in both, but at least one value is different
- Same — a row that is completely unchanged
For every row marked Changed, the tool goes one step further: it highlights the exact cell (or cells) that changed, in a separate colour from the rest of the row. You are never left guessing which field moved. Because matching happens by a unique key column, not by row position, adding or deleting rows in either dataset never misaligns the comparison, the exact failure mode that breaks position-based formulas.
The Enterprise edition adds an Audit Log: a running, timestamped record of who ran each action and what the result was. This is the feature that turns a comparison exercise into something you can present as evidence of a completed review.
Watch the Full Video Tutorial
See the full setup and comparison run end to end — loading Old and New data, setting the key column, and reviewing the classified output.
Compare Two Excel Sheets for Differences: The Options Side by Side
| Excel Spreadsheet Compare / Inquire | Web-based diff tools | ExceptionGuard | |
|---|---|---|---|
| Requires IT install or admin rights | No install, but requires COM add-in activation | No install, runs in browser | No install, runs inside a standard Excel workbook |
| Microsoft licence tier required | Enterprise / Pro Plus / E3-E5 only | None | None, works on any desktop Excel |
| Where your data goes | Stays local | Uploaded to an external server | Stays local, nothing leaves your machine |
| Row reordering / insertion handling | Weak, causes false mismatches | Moderate, depends on source structure | Strong, key-based row matching |
| Cell-level change highlighting | Yes | Varies by tool | Yes, on every changed row |
| Audit trail of who ran the comparison | No | No | Yes (Enterprise edition) |
| Tested row capacity | Adequate for small files | Varies, often capped | 500,000+ rows |
Two Ways to Use This Tool
While the tool was originally built with internal controls and audit evidence in mind, its actual use cases fall into two categories.
1. Audit-Ready Exception Reporting
If you work in finance, internal audit, or compliance, you already know that "we reviewed it" is not the same as "we can prove we reviewed it." This tool produces a classified exception report with a built-in audit trail, useful for:
- Monthly payroll change reviews
- Chart of accounts change control
- Vendor master data governance
- Any control that requires evidence changes were reviewed by a specific person, on a specific date
2. Business and HR Analytics
The same engine works equally well outside a strict compliance context. Because it classifies every row automatically, it is a fast way to run recurring analysis such as:
- Month-over-month expense comparisons
- Payroll trend tracking, overtime hours, department cost shifts, headcount changes
- HR analytics: tracking joiners, leavers, and role or department changes over time
- Comparing budget versus actual line items period to period
You do not need an audit requirement to benefit from a tool that tells you exactly what changed between two versions of your data, in seconds.
If you would rather learn the full workbook mechanics hands-on, our original Compare Data Workbook comes with a full video course covering setup, VBA customisation, and dynamic reporting — worth a look if you want the training alongside the tool.
Key Features
- Row-level classification: Added, Removed, Changed, Same, applied automatically
- Cell-level highlighting: the exact field that changed is marked separately from the rest of the row
- Key-based matching: rows are matched by a unique identifier, not by position, so inserted or deleted rows never break alignment
- Fully customisable labels and colours, set directly through Excel's own Fill Colour and Font Colour tools, no codes required
- Built as a proper Excel Table, with working filters, not a static range
- Split view: break results into four separate tabs, one per category, with one click
- Audit Log (Enterprise): timestamp, username, action, and result for every run
- Built for scale (Enterprise): tested on datasets up to and beyond 500,000 rows
- No installation, no add-in, no cloud upload: runs inside a standard macro-enabled Excel workbook, on any desktop Excel licence tier
Free vs Enterprise: What's the Difference
| Feature | Free Edition | Enterprise Edition |
|---|---|---|
| Price | Free | $49.99 one-time |
| Row limit per dataset | 24 rows | Unlimited (tested to 500k+) |
| Row and cell classification | Yes | Yes |
| Custom colours and labels | Yes | Yes |
| Split into 4 detail sheets | Yes | Yes |
| Audit Log | No | Yes |
| Best for | Trying the tool, small samples | Real payroll, HR, or finance datasets |
The Free edition is a genuine working copy of the tool, not a locked demo. It uses the identical engine as Enterprise, simply at a smaller scale, so you can properly evaluate it before deciding whether you need the full version.
Free Edition
24 rows per dataset · Same engine as Enterprise
Enterprise Edition
Unlimited rows (500k+) · Audit Log · One-time payment
One-time payment · Free updates
How to Compare Two Excel Sheets for Differences: Step by Step
Paste your "Old" dataset. into the Old Data tab and format it as an Excel Table.
Paste your "New" dataset. into the New Data tab, same format.
Open the Config tab. and set your unique identifier column, for example, Employee Code, Account Number, or Vendor ID.
Optionally customise. the labels and colours for each category, directly using Excel's Fill Colour and Font Colour tools.
Click Validate Keys. to catch duplicate or missing identifiers before comparing.
Click Compare Data. Results appear in seconds, fully classified and colour-coded.
Review, filter, or split. the results into separate tabs as needed.
Common Mistakes to Avoid
- Comparing unclean data. This tool does not clean your data for you. Remove duplicates and standardise formatting first.
- Mismatched columns. Old and New data must have the same column structure. If your source system changes column order between exports, fix that before comparing.
- Editing the results sheets by hand. These are rebuilt automatically each time you run a comparison, so manual edits will be overwritten.
- Ignoring macro security settings. This is a macro-enabled workbook. If your organisation's IT policy blocks macros by default, that is a standard security control, not a fault in the file.
Power Query is a good option for cleaning up messy exports before you compare them. See my guide on transforming messy data with Power Query.
Who This Is Built For
- Finance and accounting teams reviewing payroll, chart of accounts, or vendor master changes
- Internal audit and compliance teams needing evidence of a completed data review
- HR teams tracking joiners, leavers, and role changes month over month
- FP&A analysts comparing budget-to-actual or expense trends across periods
- Anyone who regularly compares two exports from the same ERP or HR system, and is blocked from installing desktop add-ins by IT policy
Browse the full set of finance tools on the FinDataPro templates page.
Frequently Asked Questions
What is the best way to compare two Excel sheets for differences?▼
Why is my VLOOKUP or XLOOKUP formula returning false matches when comparing two sheets?▼
Why is the Spreadsheet Compare tool missing from my Excel ribbon?▼
Can this tool compare payroll data month over month?▼
Is it safe to upload proprietary corporate data to online Excel comparison tools?▼
What is the row limit on the Free version?▼
Does this tool require Power BI, an add-in, or admin rights to install?▼
Download ExceptionGuard
The Free edition is available to download directly, just enter your email below. The Enterprise edition, with unlimited rows and the built-in Audit Log, is available for purchase at $49.99, one-time payment.
Prashant Panchal is a Chartered Accountant (ACA) and Financial Modelling & Valuation Analyst (FMVA®) with 19 years of experience in finance, FP&A, and financial modelling across the GCC region. He is the founder of FinDataPro.
Discussion
Leave a Comment
Comments are moderated and appear once approved.