Convert a Nested AR Aging Report Using Power Query Excel
If you are an accountant downloading aging reports from an older ERP, you probably know the pain of nested data. You are staring at a report where the customer name is on one row, and their unpaid invoices are indented underneath. To analyze it, you need to manually drag the customer name down next to every invoice. It is tedious, error-prone, and soul-crushing. But there is a better way to handle this workflow: convert a nested AR aging report using Power Query Excel.
Every ERP generates aging reports optimised for printing, not analysis. Customer names occupy their own header row. Subtotals are hardcoded into the data. Blank spacing rows break every formula range.
The result: finance teams rebuild the same transformation manually, every single month-end. This guide shows you how to eliminate that workflow permanently — and introduces a free, pre-configured tool that handles it for eight ERPs automatically.

ACA | FMVA® | 19 Years in Finance
The Nested Report Nightmare: Why Convert Nested AR Aging Reports?
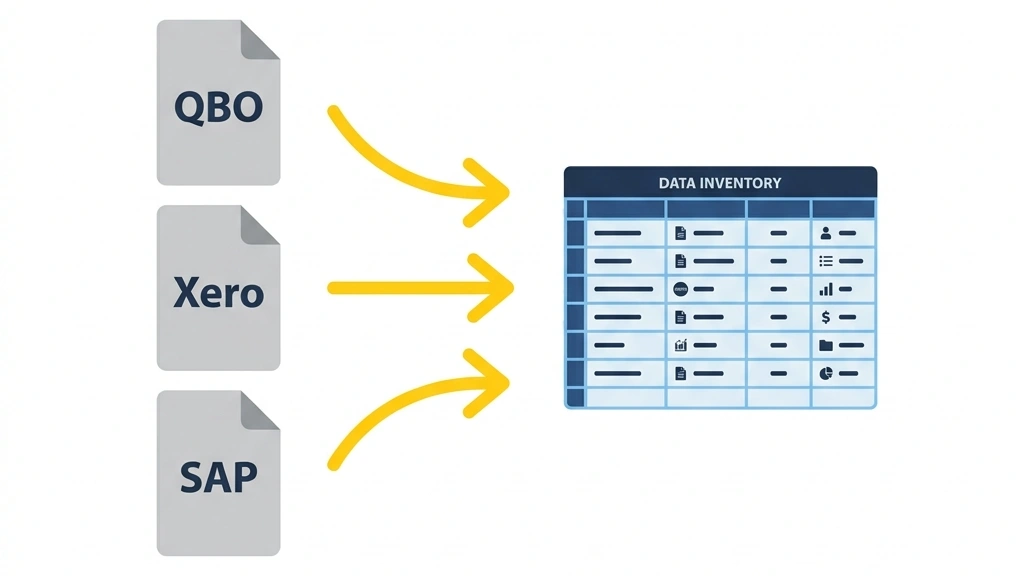
Native exports from systems like SAP, QuickBooks, NetSuite, Xero, and Microsoft Dynamics prioritise human readability over structural data integrity. The resulting output presents critical architecture flaws that compromise downstream reporting.
Merged Headers
Customer names occupy a single row above their respective invoice details rather than repeating alongside each transaction. Every analysis tool — pivot tables, SUMIFS, Power BI — requires a dedicated column, not a header row.
Hardcoded Subtotals
System-generated sums are embedded within data columns, causing double-counting errors during ledger reconciliation. A SUM formula over this data will include both the transactions and the totals — inflating your reported balances.
Inconsistent Spacing
Blank rows break contiguous data ranges, making it impossible for SUMIFS, pivot tables, or any range-based formula to recognise the full dataset. Analysts end up manually deleting these every month.
Relying on legacy manual workflows introduces immense operational risk. To fix ERP exports permanently, you must implement a programmatic, repeatable ETL pipeline. Power Query Excel is the right tool: no VBA, no manual maintenance, and it refreshes automatically when the source file updates.
The Transformation Framework
The objective is to transform a multi-layered visual layout into a normalised, tabular database structure. The pipeline has four deterministic stages:
Remove Blank Rows & Structural Noise
Filter out system timestamps, page numbers, blank spacing rows, and hardcoded subtotal markers. This creates a contiguous block of raw transaction data — the foundation for everything that follows.
Conditional Column + Fill Down
Create a conditional column that captures the customer name from its header row. Then Fill Down to propagate it to every invoice row beneath it. This is the single most important transformation — without it, every aggregation misattributes invoices.
Filter Out Residual Subtotals
Once customer attribution is correctly mapped, the original header rows and subtotal markers are redundant. Filtering them leaves only true transactional data — no risk of double-counting.
Unpivot the Aging Matrix
Convert horizontal aging buckets (Current, 30 Days, 60 Days, 90+) into a vertical Aging Bucket column. A horizontal matrix can be read by a human. A vertical table can be filtered, pivoted, summed by bucket, and connected to any dashboard tool.
Each stage is deterministic. The same input always produces the same output. That is the difference between a repeatable financial process and a monthly manual exercise.
Step-by-Step: Convert a Nested AR Aging Report Using Power Query Excel
Load your raw file into the Power Query Editor via Data → Get Data → From File. Avoid modifying the source sheet manually before loading — any pre-processing you do manually will need to be redone every time the file updates.
Step 1 — Isolate Headers and Remove Blank Rows
Your raw extract contains system timestamps, page numbers, and empty spacing blocks that break table structure.
- Use the column filter dropdown to remove null values and blank lines
- Filter out hardcoded string patterns such as "Total", "Balance", or page markers
- Use row threshold scanning to ensure valid transactions remain intact
Step 2 — Capture and Propagate the Customer Identity
Because the customer name sits on its own row above the invoice data, you must transform it into a dedicated column field.
- Create a conditional column named [Customer Name]
- Set the logic: IF [Column 1] matches your account code format THEN [Column 1] ELSE null
- Select the [Customer Name] column, right-click, and execute Fill Down
This is the critical step
Fill Down fills every empty cell below with the correct customer attribution, aligning each invoice row with its entity. Without it, every aggregation you run will misattribute invoices to the wrong customer.
Step 3 — Filter Out Residual Subtotal Records
Once customer attributes are correctly mapped to each row, the original header rows and subtotal markers become redundant structural noise. Filter the core invoice column to remove the original text header rows. Subtotal rows left in the dataset cause double-counting — in an AR context, your reported total receivables will be wrong by a material amount.
Step 4 — Unpivot the Aging Report Matrix
Aging data typically spans multiple horizontal buckets. To build a dynamic dashboard or run proper analysis, convert this horizontal matrix into a vertical table format.
- Multi-select the structural identifier columns: [Customer Name], [Invoice Number], [Date]
- Right-click any selected column header and choose Unpivot Other Columns
- Rename [Attribute] → [Aging Bucket] and [Value] → [Outstanding Amount]
Watch: Full Tool Walkthrough
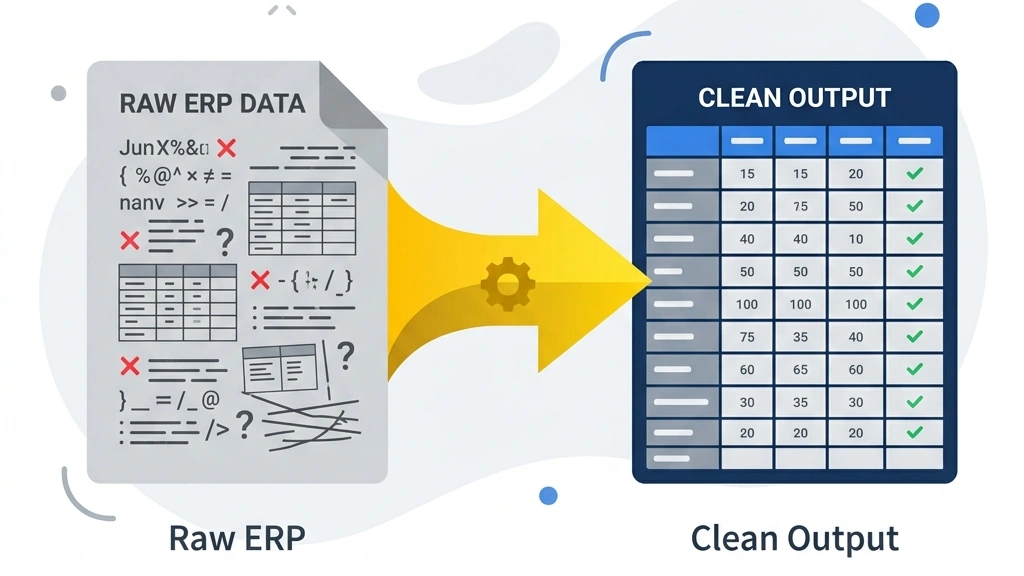
Before vs. After: The Data Structure Difference
The difference between raw and normalised is not cosmetic. The raw format is a report. The normalised output is a dataset. Only the dataset can support pivot tables, SUMIFS, Power BI, and any repeatable analysis workflow.
Raw Nested Format — ERP Export
| Column 1 | Column 2 | Column 3 | Column 4 |
|---|---|---|---|
| A1 Customer Inc | |||
| — | INV-001 | 15-May | 5,000 |
| — | INV-002 | 02-Jun | 2,500 |
| Total A1 | 7,500 | ||
| — blank row — | |||
Normalised Database Output
| Customer | Invoice | Bucket | Amount |
|---|---|---|---|
| A1 Customer | INV-001 | 30 Days | 5,000 |
| A1 Customer | INV-002 | Current | 2,500 |
Pivot-table ready. SUMIFS compatible. Power BI ready.
Download the AR/AP Aging Report Flattener — Free
Pre-configured for QuickBooks, Xero, SAP, NetSuite, Dynamics 365, Zoho, Sage, and Tally Prime. Drop files in a folder, click Refresh.
Production Integration
Click Close & Load To and select Table to output the clean data directly into your target worksheet. When next month's report arrives, save it over the old file and click Refresh All.
The Power Query engine automatically handles the structural configuration, updating your downstream models instantly. No reformatting. No fill-down. No deleting subtotals manually.
For complex enterprise structures featuring multi-currency layers, consolidated entity hierarchies, or unique SAP AR aging formats, a pre-configured automation pipeline eliminates the per-ERP setup work entirely — which is exactly what the AR/AP Aging Report Flattener was built to do.
QBO
QuickBooks Online
XRO
Xero
ZHO
Zoho Books
D365
MS Dynamics 365
SAP
SAP Business One
NS
Oracle NetSuite
SGE
Sage
TPM
Tally Prime
Skip the Build — Use the Pre-Configured Tool
If you work across multiple ERPs — QBO, Xero, Dynamics, SAP, NetSuite, Zoho, Sage, Tally Prime — rebuilding this pipeline from scratch for each one is not the right use of your time.
The AR/AP Aging Report Flattener from FinDataPro is a production-ready Power Query workbook that handles all of this automatically:
- Auto-discovers aging export files — No file names to configure — it reads every file in the designated folder
- Auto-detects the header row — No row counting — the tool finds the data start automatically
- One setup row per ERP — Covers every file from that system, now and in future
- Extended aging buckets — Supports up to 720+ days — not just the standard 90+
- Works for both AR and AP — Identical flattening logic for accounts receivable and accounts payable exports
- 8 ERPs supported out of the box — QuickBooks Online, Xero, Zoho Books, MS Dynamics 365, SAP Business One, Oracle NetSuite, Sage, Tally Prime
Drop your exports in a folder. Hit Refresh. Flat, typed, sorted output — ready for analysis.
Also worth reading: Power Query for accounting processes — a broader guide to automating your data workflows.
Frequently Asked Questions
What ERPs does the AR/AP Aging Report Flattener support?
The tool supports QuickBooks Online, Xero, Zoho Books, Microsoft Dynamics 365, SAP Business One, Oracle NetSuite, Sage, and Tally Prime out of the box. One setup row per ERP covers every file from that system, now and in future.
Do I need to know Power Query to use this tool?
No. The workbook is pre-configured. You drop your export files in a folder, fill in one setup row per ERP the first time, and click Refresh All. No M code required.
What Excel version do I need?
Excel 2016 or later, or any Microsoft 365 subscription. Power Query is built in from Excel 2016 onwards.
Can the tool handle aging buckets beyond 90 days?
Yes. The tool supports extended aging buckets up to 720+ days, not just the standard Current/30/60/90+ structure. It handles whatever aging columns your ERP exports.
Does the tool work for AP as well as AR?
Yes. The same flattening logic applies to both AR and AP aging reports. The structural problems — nested vendor names, merged headers, hardcoded subtotals — are identical across both.
What happens when I get next month's report?
Save the new file over the old one in the designated folder and click Refresh All. The Power Query engine re-runs all transformations automatically. No manual reformatting needed.
Is this tool free?
Yes. The AR/AP Aging Report Flattener is free. Enter your email and the download link is sent to your inbox. You also receive a confirmation email with the link for future reference.
Stop Rebuilding the Same Aging Report Every Month
Flattening AR and AP aging exports manually is one of those tasks that feels unavoidable until you have automated it once. The AR/AP Aging Report Flattener does not require a developer, a consultant, or any Power Query knowledge. It requires one setup row per ERP — and after that, the only action is dropping a file in a folder and pressing Refresh.
The output is the same every time: a clean, flat, typed, sorted dataset ready for your pivot tables, Power BI reports, or SUMIFS models. Deterministic, repeatable, and maintenance-free.
Also relevant: How to Consolidate Bank Statements in Excel Automatically — the same build-once, refresh-forever principle applied to bank data from any bank, any country.
Download the AR/AP Aging Report Flattener
Free. Supports 8 ERPs. Drop files in a folder, click Refresh. Flat, analysis-ready output every time.
Free. Works with Excel 2016 and Microsoft 365. Download link sent to your inbox instantly.
Prashant Panchal is a Chartered Accountant (ACA) and Financial Modelling & Valuation Analyst (FMVA®) with 19 years of experience in finance, FP&A, and financial modelling across the GCC region. He is the founder of FinDataPro.
Discussion
Leave a Comment
Comments are moderated and appear once approved.