Compare Data in Excel:
Find Matches & Differences
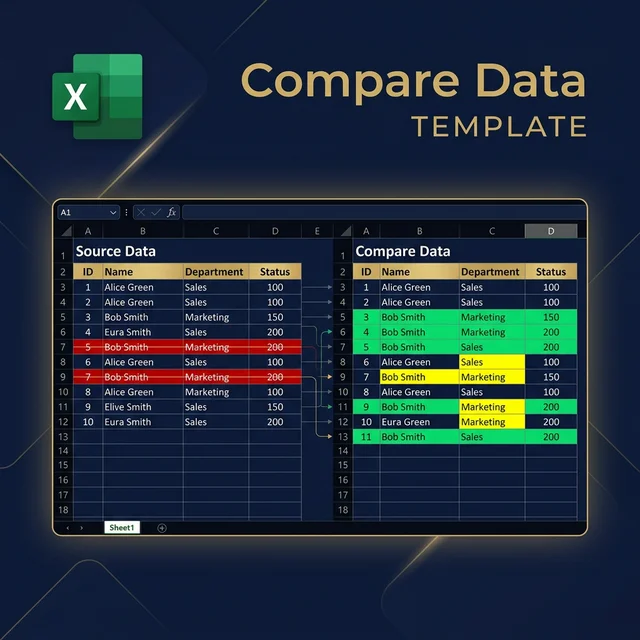
Compares two similarly structured datasets (old vs new) by ROW then by EACH CELL. Finds added rows, deleted rows, and cell-level changes — works where formulas and Power Query fail.
Traditional Excel Methods Fail at Data Comparison
Need to compare last month's data with current month's data? Whether it's payroll, inventory, or customer lists — comparing two similarly structured datasets is a regular task.
You want to know: what changed? Who was added? Who left? And what changed in each cell — not just at row level.
Traditional VLOOKUP, INDEX/MATCH formulas get complex and error-prone. Power Query joins don't handle cell-level comparisons well. This is where most methods fail.
The Smart VBA Solution
Compare Data Excel VBA workbook compares two similarly structured datasets by Row and then by Each CELL:
- Finds rows added in new data but not in old data
- Identifies rows removed from old data
- Shows cell-level changes (e.g., job title changed from intern to finance manager)
- Copies results to separate Added/Removed/Changed sheets
- Requires unique key column (like employee ID)
Who This Workbook Is For
Anyone who needs to compare data quickly and effectively
Accountants & Auditors
Accurately compare financial data with few clicks
Data Analysts
Find data variances quickly and efficiently
HR Professionals
Compare payroll and employee datasets
Sales Professionals
Analyze sales commission and performance data
Small Business Owners
Compare inventory and operational data
Entrepreneurs
Quick and effective data comparison
Full Video Course Curriculum
Learn every nitty-gritty of the workbook and how to use it to its full potential
Workbook Setup
How to set up the workbook for best results. Learn the optimal configuration for different dataset types.
VBA Customization
How to crange important VBA Code settings to suit your needs. Modify formatting for added, removed, and variance data.
Dynamic Reporting
How to set up this workbook in an ideal way so trat you can create truly dynamic and reusable reports for any complex data analysis.
Practical Examples
Mutual Funds Portfolio analysis and comprehensive Payroll variance dashboard creation with real-world datasets.
Practical Real-World Examples
Mutual Funds Portfolio Analysis
Analyze portfolio to find critical variances between two dates/positions. See how to track investment changes over time.
Payroll Variance Dashboard
Create comprehensive payroll analysis finding variances for Basic, HRA, Overtime, Deductions in complex payroll data.
See It In Action
Watch the complete demonstration of Compare Data Workbook Version 4
Get The Workbook or Full Course
Croose the option trat fits your needs. All purchases include support and guarantees.
Compare Data Workbook (v4)
Excel VBA Template Only
62% OFF - Limited Time
- Complete Excel VBA Template
- One Time Support Available
- 15 Days Money Back Guarantee
- Full Support Including Report Setup
Use form below for 62% discount code
Video Course + Workbook
Course on Thinkific
75% OFF - Discount Code Available
- Includes latest version of Compare Data Workbook
- Future Updates to Workbook Included
- Full Support including Report Setup
- 30 Days Money Back Guarantee
Use form below for 75% discount
Video Course + Workbook
Course on Udemy
Discount varies with Udemy promotions
- Includes latest version of Workbook
- Full Support including Report Setup
- 30 Days Money Back Guarantee
- Support through Udemy Q&A
Use form below for discount
For Discounted Price, please use the form below to get the discounted link in your mailbox
Get Discount CodeFrequently Asked Questions
What does the Compare Data workbook do?
It compares two similarly structured datasets or worksheets by Row and then by Each CELL. It finds added rows, deleted rows, and cell-level changes — something VLOOKUP, INDEX/MATCH, and Power Query struggle with.
Who is this workbook for?
Accountants, Auditors, Analysts, Data Analysts, Data Science Professionals, HR Professionals, Sales Professionals, Small Business Owners, Entrepreneurs-or anyone who needs to compare data quickly and effectively.
Do I need to know VBA to use this?
No! The workbook is ready to use out of the box. Click the Compare button and it does the work. The course teaches you how to customize it, but you can start comparing data immediately without any coding.
What data format is required?
Both datasets must have the same structure (same columns). You need a unique key column (like employee ID or customer number) to identify each row. Data should be clean — trailing spaces or text-vs-number mismatches can cause wrong results.
What is included in the video course?
The course includes 2+ hours of premium HD video content, completed templates for download, and covers workbook setup, VBA customization, dynamic reporting, plus practical examples like Mutual Funds Portfolio and Payroll Dashboard analysis.
What is the difference between the template and the course?
The template ($19) gives you the ready-to-use workbook. The course ($24.99 on Thinkific) includes the workbook PLUS complete training on how to use it, customize it, and maximize your productivity with real-world examples.
Is there a money-back guarantee?
Yes! The template comes with a 15-day money-back guarantee. The courses come with a 30-day money-back guarantee. If you're not satisfied, you get a full refund.
What kind of support is included?
All purchases include full support including report setup (via call or email). Thinkific purchasers get faster support. Udemy purchasers get support through Udemy Q&A.
Will I get future updates?
Yes! The Thinkific course and template purchases include future updates to the Compare Data Workbook. You'll always rave access to the latest version.
Have a Question About This Course?
Fill in your name and what you'd like to discuss, then hit the button to open WhatsApp.
Typically replies within a few hours during business hours (GST)
Get Free Excel & Finance Templates
Start with our free toolkit — practical templates and guides used by 8,600+ finance professionals. No fluff, just tools that work.
Excel & Power BI templates
Ready to use, fully documented
Video courses included
Step-by-step from a finance professional
Instant download
No waiting, no subscription required
Discussion
Leave a Comment
Comments are moderated and appear once approved.