
Power Pivot's 92 New DAX Functions From Power BI: What Actually Changed, and What's Still Missing in 2026
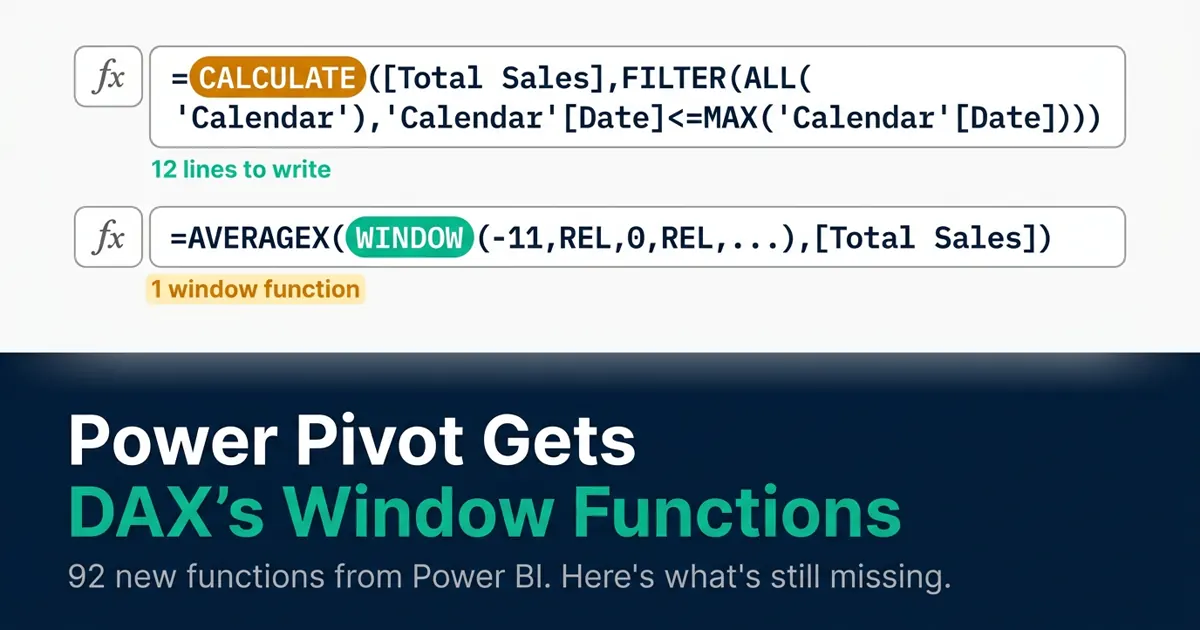
Microsoft brought 92 DAX functions from Power BI into Excel Power Pivot. Here's exactly what changed, how to check you have it, and what's still missing in 2026.

ACA | FMVA® | 19 Years in Finance
If you've maintained a Power Pivot model for any length of time, you've hit the wall: a DAX measure that works perfectly in Power BI Desktop throws a syntax error the moment you paste it into Excel. That gap is real and well documented, and in October 2022 Microsoft closed a large chunk of it in one release. 92 DAX functions, previously exclusive to Power BI, became available inside Excel's Power Pivot.
This guide covers exactly what that update included, how to confirm you actually have it, a worked example of the single most useful addition, and, just as important, which newer Power BI functions still haven't made the jump across, based on Microsoft's own current documentation.
The Actual Announcement: What Microsoft Said, and When
The update was announced by Howard Su, a Product Manager on the Excel Team, on the official Microsoft 365 Insider blog. The core line from that post is worth quoting directly: the addition of these functions was explicitly framed as bringing Excel "closer to parity with Power BI Desktop." It shipped first to Beta Channel Insiders running Version 2208, Build 15504.10000 or later, before rolling out more broadly.
That's the part worth being upfront about: this happened in October 2022, not last month. If you've been running an older, slower-updating build of Microsoft 365, common in larger organisations with IT-managed update channels, you may be seeing this "new" capability for the first time now, even though it's been in the Current Channel for years. Worth checking your build number before assuming it's missing entirely.
Why Power Pivot Fell Behind Power BI in the First Place
Power Pivot and Power BI Desktop run on the same underlying technology, the Tabular/VertiPaq engine, and the same DAX language. But they've never shared a release cadence. Power BI Desktop ships monthly, with new DAX functions landing as part of that cycle. Power Pivot, bundled inside Excel, follows Office's release schedule instead, far less frequent and historically much more conservative about what gets backported.
Microsoft's own DAX function reference states this plainly: new and updated functions are typically introduced first in Power BI Desktop, then later in Analysis Services, Power Pivot in Excel, and other tools. That's not a one-time gap that got fixed in 2022, it's the structural pattern the two products have always followed, and the 2022 update was a large, deliberate catch-up pass rather than a permanent change to that pattern. That distinction matters for the second half of this article.
What the 92 New Functions Actually Added
The full 92-function list spans several categories, but the headline addition, the one that actually changes what you can build in a Power Pivot model, is the window function family.
Window Functions: WINDOW, OFFSET, INDEX, PARTITIONBY, ORDERBY
Before this update, calculating something like a trailing 12-month average or a prior-period comparison inside Power Pivot meant nesting CALCULATE, FILTER, and ALL in increasingly elaborate combinations. Functional, but slow to write, slower to audit, and often expensive for the engine to evaluate. The window functions replace that pattern with explicit, SQL-style windowing syntax:
- WINDOW returns a slice of rows based on relative or absolute boundaries within an ordered set, the direct tool for rolling averages and trailing sums.
- OFFSET shifts to a row a specified number of positions away from the current one within a partition, the natural fit for "same measure, one period back" comparisons.
- INDEX retrieves a row at an explicit position within a sorted, partitioned set.
- PARTITIONBY and ORDERBY are the supporting clauses both of the above depend on. They define how the data gets grouped and sorted before WINDOW or OFFSET act on it.
If you're still building your first DAX measures, the DAX 80/20 rule guide covers the 15 to 20 functions worth learning before you touch window functions at all.
Utility and Export Functions: TOJSON, TOCSV, EVALUATEANDLOG
These are less glamorous but genuinely useful for anyone troubleshooting a model. TOJSON and TOCSV serialise table expressions into text formats you can inspect or export directly from a DAX query, and EVALUATEANDLOG writes intermediate query results to Microsoft's diagnostic logging, a meaningfully faster way to debug a misbehaving measure than guessing.
Date Calculations: NETWORKDAYS
NETWORKDAYS made the jump too, giving Power Pivot a native way to count working days between two dates, excluding weekends and, where a holiday table is supplied, specified non-working days, without requiring a manually built calendar-flag workaround.
How to Check If You Actually Have Access
Confirming access is straightforward:
- Check your Microsoft 365 build number via File → Account → About Excel. You need Version 2208 (Build 15504.10000) or later. Anything from 2023 onward almost certainly clears this, but IT-managed Current Channel (Business) or Semi-Annual Enterprise Channel deployments can lag well behind.
- Confirm Power Pivot is actually enabled: File → Options → Add-ins → COM Add-ins → Manage → Go, then tick Microsoft Power Pivot for Excel if it isn't already active.
- Test with a simple new-function formula, such as
=WINDOW(-1, REL, 0, REL, ...)against any date-based table, rather than assuming availability from the version number alone.
That third step matters more than it sounds like it should. In September 2023, multiple Power Pivot users reported these functions disappearing entirely after an update, despite being on a qualifying build, in the comment thread on Excelerator BI's coverage of the update. Microsoft confirmed the issue and shared a registry-key workaround: creating a string value named Microsoft.Office.Excel.EnablePowerPivotASEngineV16 under HKEY_CURRENT_USER\Software\Microsoft\Office\16.0\Common\ExperimentEcs\Overrides, set to true, followed by an Excel restart. If your functions have quietly vanished after an update, this is the first thing worth checking before assuming your build has regressed.
Practical Example: A Rolling 12-Month Average With WINDOW
Here's what the window function family actually replaces in practice. Before this update, a trailing 12-month average in Power Pivot needed something like a DATESINPERIOD-based filter wrapped in AVERAGEX and CALCULATE, with the date logic doing a lot of implicit work that wasn't obvious from reading the formula. With WINDOW, the same calculation states its intent directly:
Moving_Average_12M :=
AVERAGEX (
    WINDOW (
        -11, REL,
        0, REL,
        ALLSELECTED ( 'Calendar'[Year], 'Calendar'[MonthName], 'Calendar'[MonthNumber] ),
        ORDERBY ( 'Calendar'[Year], ASC, 'Calendar'[MonthNumber], ASC )
    ),
    [Total Sales]
)
The -11, REL and 0, REL arguments define the window boundaries explicitly, eleven periods back through the current one, twelve periods total, against a set ordered by year and month. Compare that to a filter-based equivalent that has to construct the same twelve-month boundary indirectly through date arithmetic, and the readability gap is the actual point of this update, not just the raw capability.
A previous-period comparison follows the same pattern with OFFSET:
Previous_Period_Sales :=
CALCULATE (
    [Total Sales],
    OFFSET (
        -1,
        ALLSELECTED ( 'Customer'[CustomerRegion], 'Customer'[CustomerName] ),
        ORDERBY ( 'Customer'[CustomerName], ASC ),
        KEEP,
        PARTITIONBY ( 'Customer'[CustomerRegion] )
    )
)
The explicit PARTITIONBY clause is what keeps this calculation correctly scoped to each customer's own region. Without it, "previous period" could silently pull a value from an entirely different region's customer list.
The Parity Gap That Reopened: What's Still Power BI-Only in 2026
This is the part most coverage of the 2022 update leaves out, and it's the genuinely current story: the parity gap Microsoft closed in 2022 has partially reopened, because Power BI Desktop hasn't stopped shipping new DAX functions since. Checking Microsoft's own DAX function reference as it stands today, the following have landed in Power BI Desktop with no confirmed Power Pivot equivalent yet:
| Function | Introduced (Power BI) | Power Pivot Status |
|---|---|---|
| RANK | April 2023 | Not confirmed in Power Pivot |
| ROWNUMBER | April 2023 | Not confirmed in Power Pivot |
| MATCHBY | May 2023 | Not confirmed in Power Pivot |
| LINEST | February 2023 | Not confirmed in Power Pivot |
| LINESTX | February 2023 | Not confirmed in Power Pivot |
| STARTOFWEEK | September 2025 | Not confirmed in Power Pivot |
| ENDOFWEEK | September 2025 | Not confirmed in Power Pivot |
| OPENINGBALANCEWEEK | September 2025 | Not confirmed in Power Pivot |
| CLOSINGBALANCEWEEK | September 2025 | Not confirmed in Power Pivot |
| NEXTWEEK | September 2025 | Not confirmed in Power Pivot |
| PREVIOUSWEEK | September 2025 | Not confirmed in Power Pivot |
| TOTALWTD | September 2025 | Not confirmed in Power Pivot |
| TABLEOF | February 2026 | Not confirmed in Power Pivot |
Worth noting: RANK and ROWNUMBER specifically would be a meaningful addition if they do arrive. They solve multi-column ranking and tie-breaking cleanly in a way the older RANKX function genuinely struggles with, since RANKX can only rank on a single expression at a time. If your model leans on ranking logic, this is the function pair worth watching for.
A handful of the more recent Power BI additions, FIRST, LAST, NEXT, PREVIOUS, LOOKUP, LOOKUPWITHTOTALS, are excluded from this table because they're restricted to Power BI's visual calculations feature specifically, which has no Power Pivot equivalent to receive them into. Their absence isn't a parity gap in the same sense as the functions above, it's a different feature surface entirely.
What This Means for Finance and BI Teams Still Using Excel
If your organisation builds semantic models centrally in Power BI Desktop and distributes them for ad-hoc analysis in Excel, the 2022 update meaningfully reduces the friction of that workflow. Window-function-based measures built in Power BI Desktop are now far more likely to work unmodified when recreated or connected to in Power Pivot. But the table above is the practical takeaway for day-to-day model building: don't assume a DAX function you've seen in a recent Power BI tutorial is available in Power Pivot just because the 2022 update happened. Check the function's introduction date against Power Pivot's actual confirmed support before building a measure your Excel-based colleagues won't be able to open.
The pragmatic approach for a hybrid team: treat Power BI Desktop as the place to prototype using the newest functions, and confirm Power Pivot compatibility specifically before that logic needs to run inside a distributed Excel workbook, rather than assuming the platforms have converged. If your team is still deciding which platform should own a given model, the Power BI and DAX hub has the wider set of guides on that decision, and the Power BI MCP server setup guide is worth a look if you're building models with AI assistance across both tools.
Frequently Asked Questions
When did Microsoft add new DAX functions to Power Pivot in Excel?
Microsoft announced this update in October 2022 via the Microsoft 365 Insider blog, adding 92 DAX functions to Power Pivot that had previously been available only in Power BI Desktop. It shipped first to Beta Channel Insiders on Build 15504.10000 or later before rolling out to the Current Channel.
What are the most useful new DAX functions in Power Pivot?
The window function family, WINDOW, OFFSET, INDEX, PARTITIONBY, and ORDERBY, is the most practically significant addition, since it replaces verbose CALCULATE and FILTER-based patterns for rolling averages and period-over-period comparisons with more direct, readable syntax.
Why did the new DAX functions disappear from my Power Pivot after an update?
Some users reported this issue in September 2023. Microsoft confirmed it as a known bug with a registry-key workaround: create a string value named Microsoft.Office.Excel.EnablePowerPivotASEngineV16 under HKEY_CURRENT_USER\Software\Microsoft\Office\16.0\Common\ExperimentEcs\Overrides, set it to true, and restart Excel.
Does Power Pivot now have full feature parity with Power BI Desktop?
No. The 2022 update closed a significant part of the gap, but Power BI Desktop has continued shipping new DAX functions since, including RANK, ROWNUMBER, LINEST, LINESTX, and an entire family of weekly time-intelligence functions, with no confirmed Power Pivot equivalent as of Microsoft's current documentation. The two products still don't share a release cadence, so this gap is structural rather than fully resolved.
What Excel version do I need for the new DAX functions in Power Pivot?
Microsoft 365 Version 2208, Build 15504.10000, or later. Check your current build via File → Account → About Excel, and note that IT-managed update channels (Current Channel Business, Semi-Annual Enterprise Channel) commonly lag well behind this.
Can Power Pivot create calculated tables using the new DAX functions?
No, this remains one of the clearest structural differences from Power BI Desktop. The new functions expand what you can calculate within Power Pivot's existing tables and measures, but the ability to create new calculated tables using DAX is still exclusive to Power BI Desktop and Analysis Services.
Conclusion: Check the Function, Not Just the Update
The 2022 update genuinely changed what's practical to build inside Power Pivot. The window function family in particular replaces a category of formulas that used to be slow to write and harder to audit. But "Power Pivot got 92 new functions" isn't the same claim as "Power Pivot is caught up," and treating it that way risks building a measure around a function, RANK or LINEST for instance, that simply isn't there yet.
Check your build number, confirm the specific function you need against Microsoft's current documentation rather than this update alone, and if you hit the disappearing-function bug, the registry fix above is the known solution.
Part of FinDataPro's Power BI and DAX coverage.
Prashant Panchal is a Chartered Accountant (ACA) and Financial Modelling & Valuation Analyst (FMVA®) with 19 years of experience in finance, FP&A, and financial modelling across the GCC region. He is the founder of FinDataPro.
Discussion
Leave a Comment
Comments are moderated and appear once approved.