
XNPV vs NPV in Excel: The Discounting Error That Breaks IFRS Valuation Models
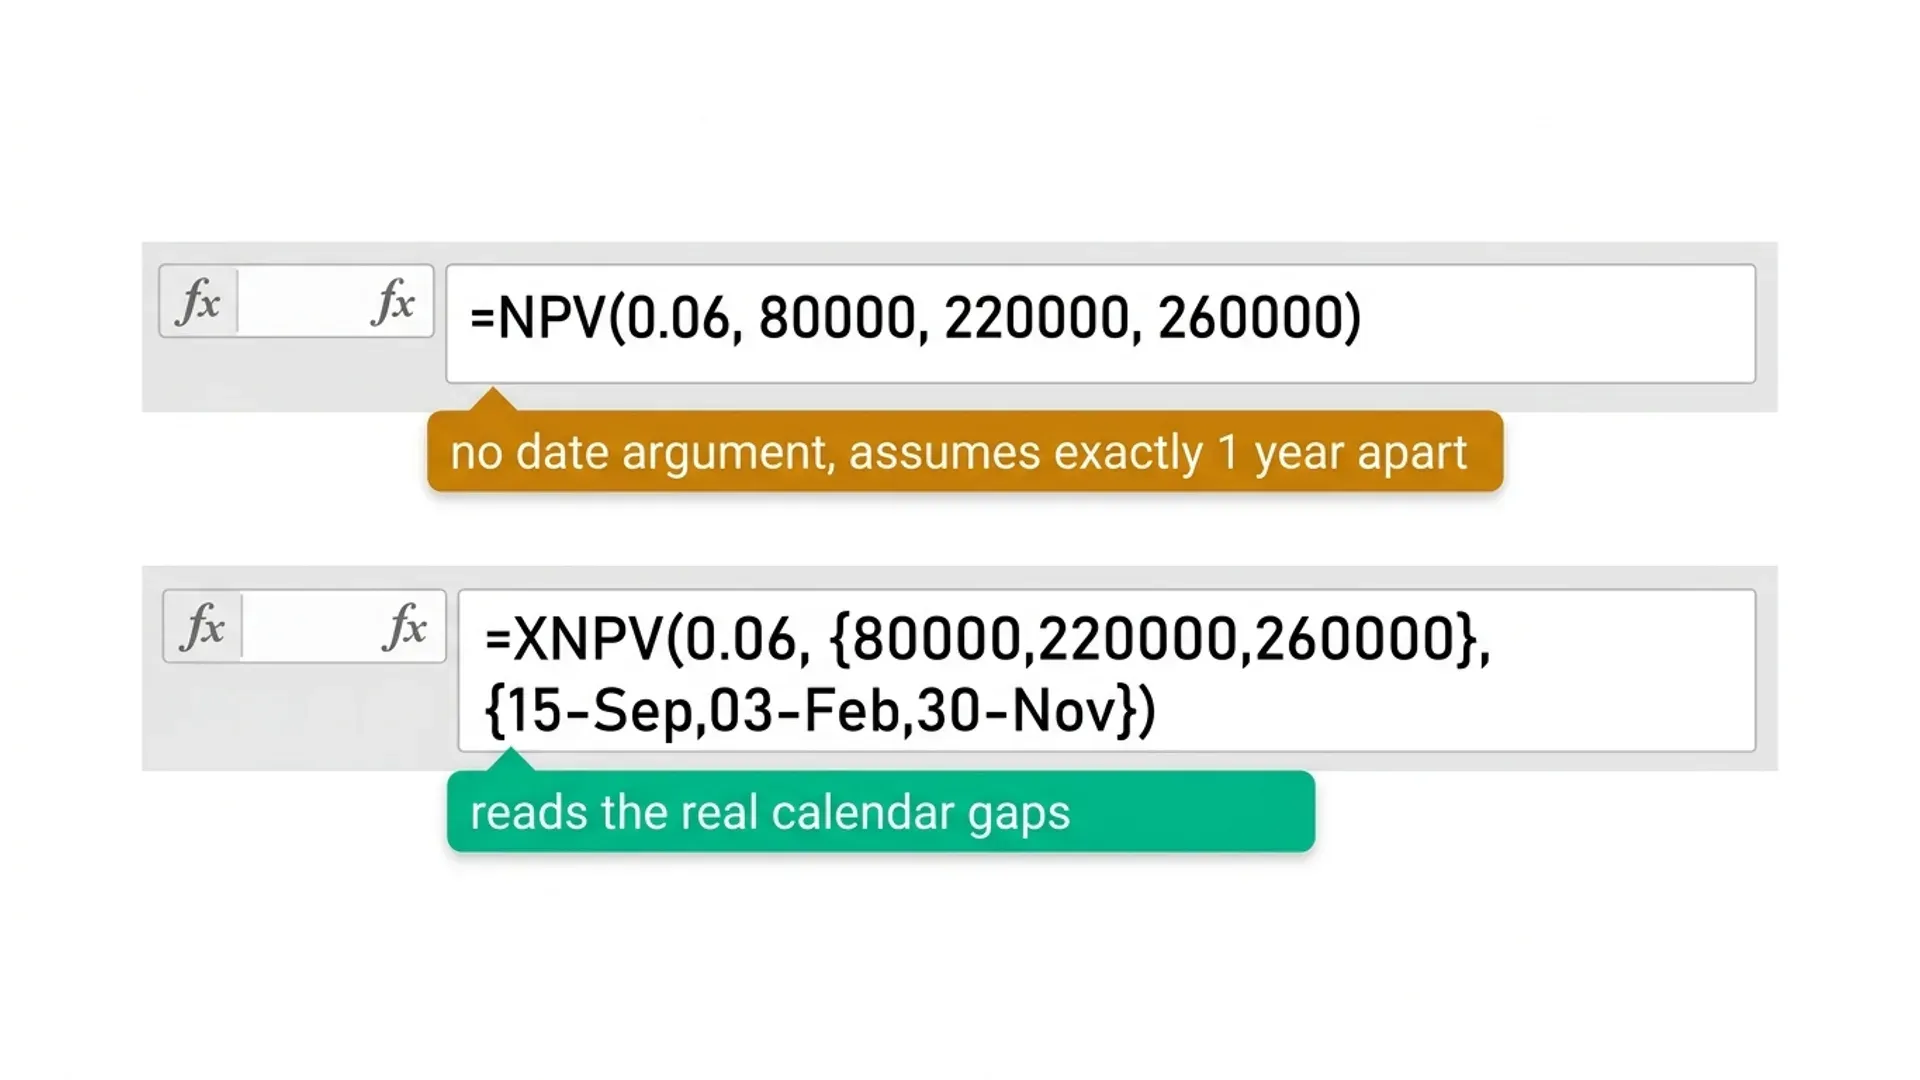
NPV assumes cash flows land exactly one year apart. XNPV doesn't. See the actual valuation error this creates and when each function belongs.

ACA | FMVA® | 19 Years in Finance
NPV assumes every cash flow in your range is exactly one period apart, starting one full period from today. It doesn't check your dates. It doesn't care that your project's first outflow happens in nine days, not twelve months, or that a disposal proceeds inflow lands eighteen months after the initial investment instead of on a clean annual anniversary. It just discounts flow one at position one period, flow two at position two periods, and so on, regardless of what your actual calendar says. XNPV reads the real dates and discounts accordingly. For a model with genuinely annual, evenly spaced flows, this difference is academic. For almost every real capital project, disposal, or impairment model, it isn't.
This guide builds the same cash flow set both ways, quantifies the actual valuation error NPV introduces, and gives a clear rule for which function belongs in which model.
The Assumption Buried Inside NPV
The NPV syntax looks innocent:
=NPV(rate, value1, value2, value3, ...)
Nowhere in that syntax is there a date argument. NPV has no way to know when value2 actually occurs, it simply assumes it falls exactly one period after value1, and value3 exactly one period after that, and so on, with the entire series starting one full period from today. If your actual cash flows are dated 15 January, 3 September, and 22 December of the same year, NPV has no mechanism to reflect that, it treats them as three cash flows one year apart regardless.
This is fine when your model genuinely has clean, equally-spaced annual flows. It's a silent, unflagged error the moment it doesn't, and nothing in Excel warns you, because the formula isn't wrong syntactically. It's just answering a different question than the one you're actually asking.
What XNPV Does Differently
Per Microsoft's official XNPV function reference:
=XNPV(rate, values, dates)
The dates array is the entire difference. XNPV discounts each cash flow based on the actual number of days between its real date and the first cash flow's date, using a 365-day-year convention, not an assumed equal-period structure. A flow that happens 47 days after the first flow gets discounted for 47/365 of a year, not for a full assumed period.
The Scenario: A Capital Project With Irregular Cash Flows
Consider a capital project for a fictional business, Meridian Group, with an initial investment followed by three return flows that don't land on clean annual anniversaries, a realistic pattern for a project with milestone-based returns rather than a fixed annual schedule.
| Date | Cash Flow | Description |
|---|---|---|
| 1 Jan Year 1 | (500,000) | Initial investment |
| 15 Sep Year 1 | 80,000 | Early milestone return |
| 3 Feb Year 2 | 220,000 | Main phase return |
| 30 Nov Year 2 | 260,000 | Final disposal proceeds |
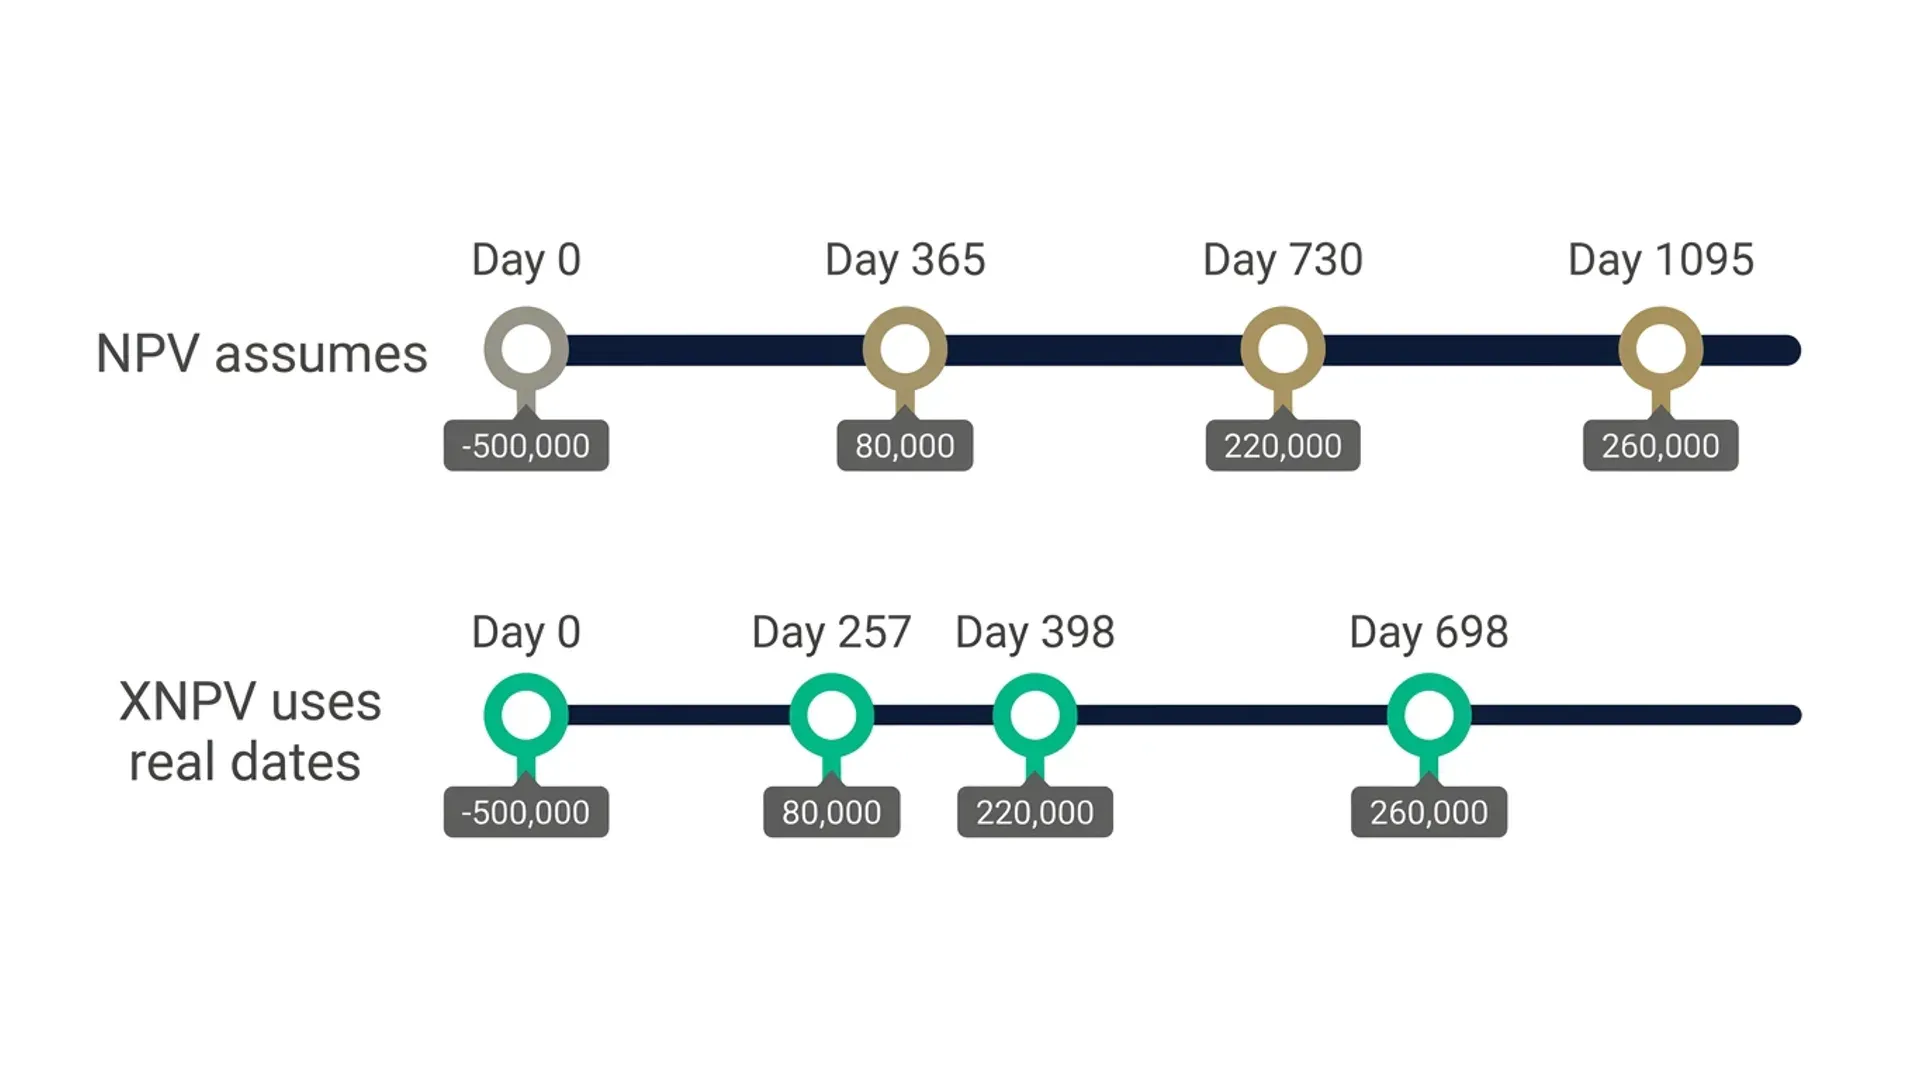
None of these flows are exactly one year apart. The gap between the first and second flow is 257 days, not 365. The gap between the third and fourth flow is 300 days, not 365 either.
Building the NPV Version
Using NPV as most models default to it, the formula treats the four flows as if they fall at positions 0, 1, 2, and 3 years, regardless of the real dates above:
=(500000) + NPV(0.06, 80000, 220000, 260000)
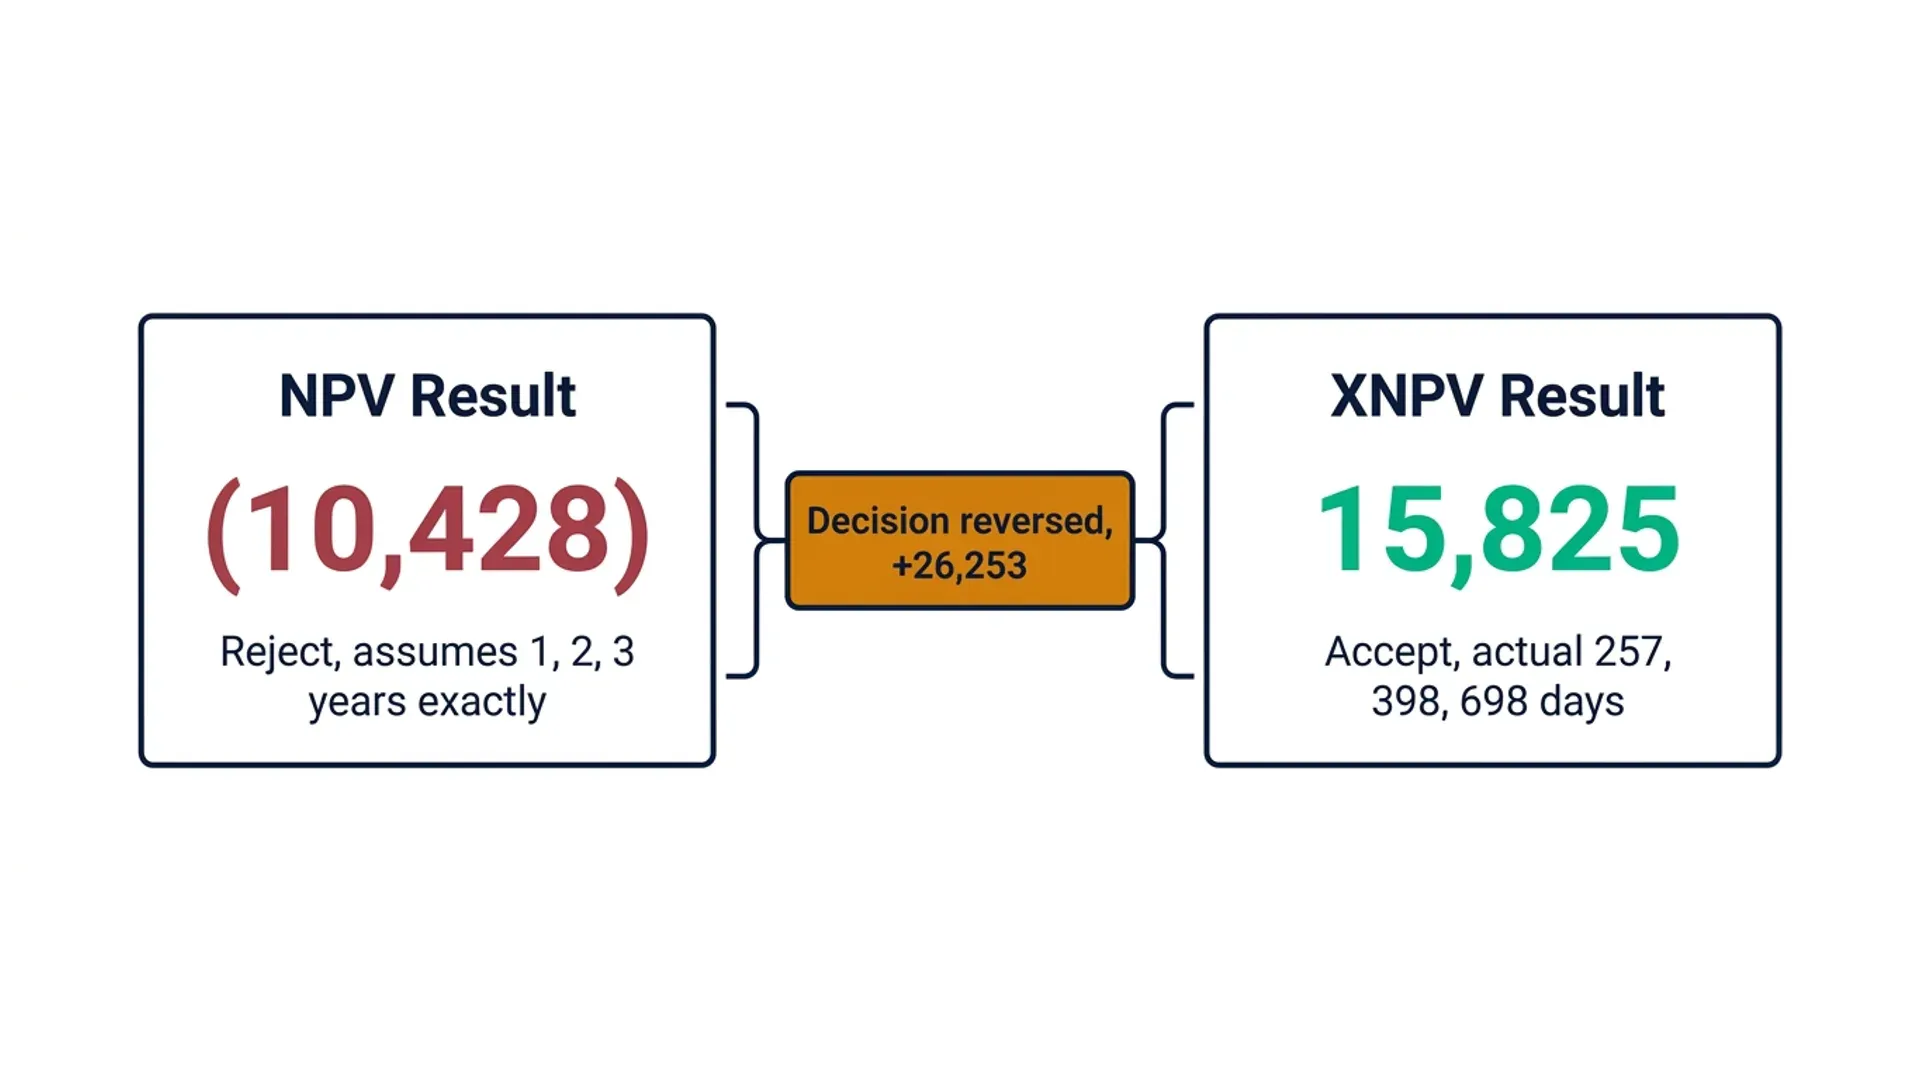
At a 6% discount rate, this returns a net present value of (10,428), a negative NPV, meaning the project would be rejected on a standard NPV-positive investment rule. But this figure assumes the 80,000 return arrived exactly one year after the investment, the 220,000 arrived exactly two years after, and the 260,000 arrived exactly three years after. None of those assumptions match the actual dates in the scenario above.
Building the XNPV Version
Using XNPV with the same cash flows and their real dates:
=XNPV(0.06, {-500000,80000,220000,260000}, {DATE(Y1,1,1),DATE(Y1,9,15),DATE(Y2,2,3),DATE(Y2,11,30)})
This returns a net present value of 15,825, a positive NPV, meaning the same project passes a standard NPV-positive rule under the correct dating. The real gaps between flows (257, 398, and 698 days) are all shorter than the twelve, twenty-four, and thirty-six full months NPV assumed. Discounting over genuinely shorter periods erodes less value, and here that difference is large enough to flip the investment decision entirely, not just move the number.
Quantifying the Discounting Error
| Method | Result | Decision (NPV-positive rule) | Assumed Timing |
|---|---|---|---|
| NPV | (10,428) | Reject | Exactly 1, 2, and 3 years after investment |
| XNPV | 15,825 | Accept | Actual dates: 257, 398, and 698 days after investment |
| Difference | 26,253 | Decision reversed | — |
This isn't a rounding difference or a modest percentage swing, it's a discounting mechanic alone flipping the investment decision from reject to accept, with no change whatsoever to the underlying cash flow forecast. On a larger capital project, or aggregated across a portfolio of projects each carrying the same silent NPV error, the risk isn't just a misstated figure, it's rejecting genuinely viable projects, or approving ones that don't actually clear the hurdle.
Why This Matters for IFRS-Based Impairment and Valuation Models
Under IAS 36, value-in-use calculations for impairment testing require discounting projected cash flows to present value, and those cash flows are frequently forecast against irregular dates: a lease renewal in month 14, a major maintenance capex in month 31, a terminal disposal at an odd point in the asset's remaining useful life. Using NPV in this context isn't just a minor modelling shortcut; it introduces a systematic error into a figure that directly affects whether an impairment charge is recognised and how large it is.
If your organisation's impairment models were built using NPV against cash flows that aren't genuinely on annual anniversaries, this is worth flagging for review, not because the model is broken, but because the discounting mechanic inside it is answering a slightly different, less accurate question than intended.
When NPV Is Still the Right Choice
NPV isn't wrong to use, it's wrong to use on the wrong data. For a model where cash flows genuinely do fall on clean, equally-spaced annual (or monthly, adjusted for periodicity) intervals, a straightforward annuity-style projection, or a simplified budget model where precision to the day isn't the point, NPV is simpler to build and audit, and the equal-period assumption matches reality closely enough not to matter.
The decision point is simple: if you can't confirm every cash flow in the series falls exactly one period apart, use XNPV. The extra step of maintaining a dates array is small compared to the risk of a silent, unflagged discounting error.
Combining XNPV With SEQUENCE for Scenario Sensitivity
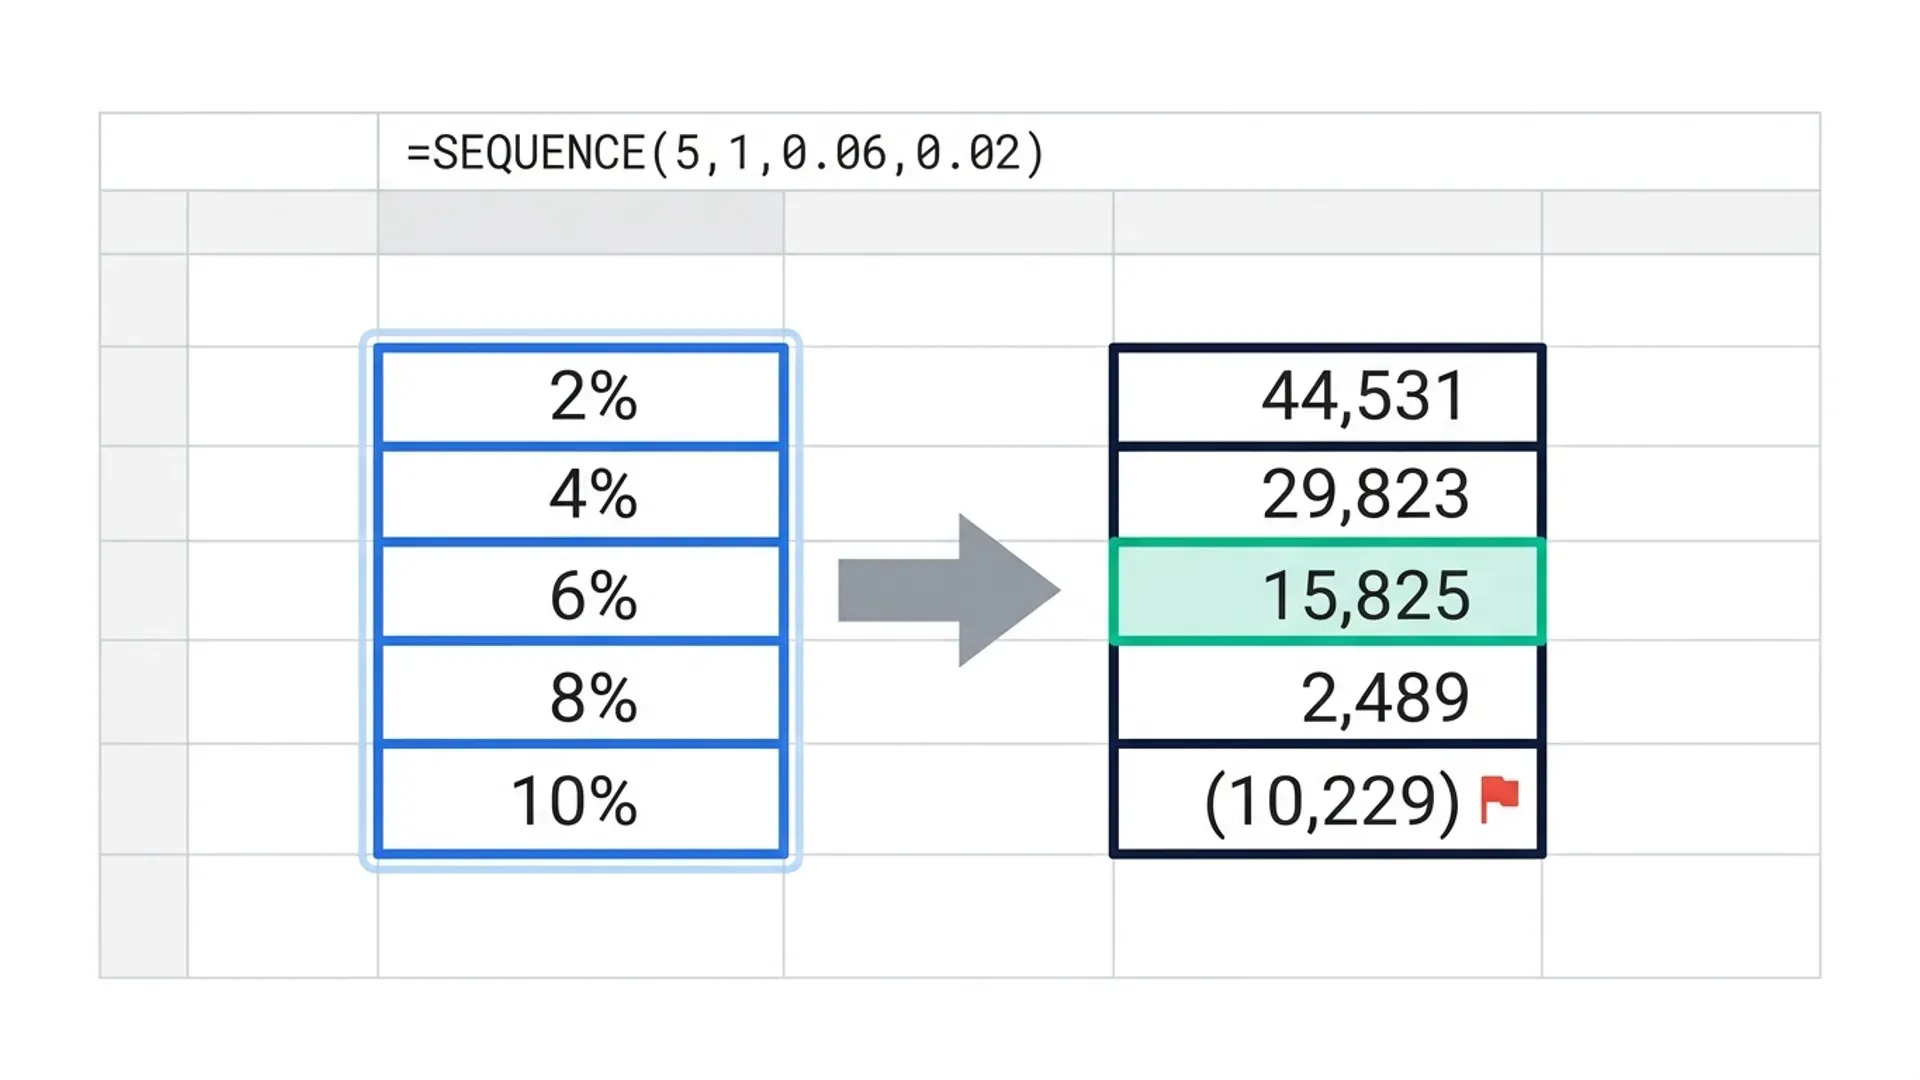
For a sensitivity table testing the project's NPV across a range of discount rates, combine XNPV with a SEQUENCE-generated rate array, the same array-generation approach covered in our SEQUENCE guide for dynamic depreciation schedules:
=XNPV(SEQUENCE(5,1,0.06,0.02), {-500000,80000,220000,260000}, {DATE(Y1,1,1),DATE(Y1,9,15),DATE(Y2,2,3),DATE(Y2,11,30)})
This generates the project's XNPV across five discount rates (2%, 4%, 6%, 8%, 10%) in one array formula, spilling a full sensitivity column without manually recalculating the formula five separate times.
Three Mistakes That Distort XNPV Results
Letting the dates and values arrays fall out of sync. XNPV matches values to dates by position in each array, not by any explicit pairing. If a row gets inserted into one array but not the other, every subsequent cash flow silently discounts against the wrong date, and nothing in Excel flags the mismatch.
Assuming XNPV requires dates in chronological order. It doesn't strictly require this, but the first date in the array is always treated as the discounting anchor point (day zero), regardless of its position in the array. Keeping dates in genuine chronological order avoids confusion when reviewing or auditing the model later, even though it isn't a hard requirement of the function itself.
Using XNPV with monthly, evenly-spaced flows out of habit. If every flow genuinely does fall on the same day each month, NPV (with a monthly-adjusted rate) is simpler to build and produces an equivalent result. XNPV isn't wrong here, but the additional dates-array maintenance is unnecessary overhead for a model that doesn't have irregular timing to begin with.
Frequently Asked Questions
How different can NPV and XNPV results actually be?
It depends entirely on how irregular the real cash flow dates are relative to NPV's assumed equal-period structure. In the worked example in this article, the difference was large enough to flip the investment decision from reject to accept, purely from the discounting mechanic. For cash flows that happen to fall close to genuine annual anniversaries, the difference shrinks toward zero; for highly irregular milestone-based flows, it can be this material or more.
Does XNPV require a specific date format?
XNPV needs its dates array populated with genuine Excel date values (serial date numbers), not text strings that look like dates. Using DATE() functions or properly formatted date cells avoids this, a common cause of a #VALUE! error is a dates array that contains text-formatted dates rather than true date values.
Can XNPV handle cash flows that aren't in chronological order?
Yes, though it's best practice to keep them ordered. XNPV treats the earliest date in the array as the discounting anchor point regardless of array position, but an unordered array is harder to audit and more prone to the values-and-dates misalignment mistake covered above.
Is XIRR affected by the same assumption problem as NPV's rate counterpart, IRR?
Yes. IRR has the identical equal-period assumption that NPV does, and XIRR solves it the same way XNPV does, by reading actual dates. If you're using XNPV for a model, XIRR is generally the appropriate rate-of-return counterpart rather than IRR.
Should every DCF or valuation model default to XNPV instead of NPV?
For any model where you can't guarantee every cash flow falls exactly one period apart from the next, yes. The only scenarios where NPV remains appropriate are ones with genuinely clean, equally-spaced periodicity, where the added complexity of maintaining a dates array doesn't buy any additional accuracy.
Does this discounting error affect lease liability or amortisation schedules too?
Amortisation schedules built with PMT, IPMT, and PPMT have their own periodicity assumptions, related but distinct from NPV's. The core lesson is the same: any Excel function with an assumed-period structure needs its assumptions checked against the actual cash flow dates before being trusted for a materially significant model.
Conclusion: Check the Assumption, Not Just the Formula
NPV isn't broken, it's precise about a narrower question than most people think they're asking it. It answers "what's the present value of these flows, assuming each one arrives exactly one period after the last," and most real capital projects, disposals, and impairment cash flows don't actually behave that way. XNPV answers the question analysts actually mean to ask: what's the present value of these flows, given when they genuinely occur.
Here's your action plan:
- Check every existing NPV-based model for cash flows that don't fall on clean, equally-spaced periods, this is the single highest-value five-minute audit you can run on an inherited valuation model.
- Default to XNPV for any capital project, disposal, or impairment cash flow set where dates aren't guaranteed to be exactly one period apart.
- Keep the values and dates arrays in strict alignment, a single inserted row in one without the other silently corrupts every downstream discount calculation.
- Pair XNPV with SEQUENCE for a one-formula discount rate sensitivity table, rather than manually rebuilding the calculation for each rate scenario.
A discounting mechanic alone flipping a project from reject to accept is not a rounding error, it's the kind of thing that changes a genuine investment decision or an impairment conclusion. Checking which function your model actually uses takes five minutes.
Part of the FinDataPro Depreciation Methods Series.
⚡Try It Yourself
XNPV and SEQUENCE-driven sensitivity tables are one piece of the model. Run full asset schedules, straight-line through declining balance, with multi-book support and automatic GL reconciliation. Start free at Depreciation Lab →
Prashant Panchal is a Chartered Accountant (ACA) and Financial Modelling & Valuation Analyst (FMVA®) with 19 years of experience in finance, FP&A, and financial modelling across the GCC region. He is the founder of FinDataPro.
Discussion
Leave a Comment
Comments are moderated and appear once approved.