
Power Query vs Excel Formulas for Account Reconciliation: A Decision Framework for Controllers

Every controller has built a reconciliation workbook that outgrew itself: the one that opened instantly with 500 rows and now takes eleven seconds to recalculate with 40,000, or the small ad-hoc check that someone insisted on running through a full Power Query pipeline when a single XLOOKUP would have done the job in two minutes.
Both mistakes come from the same root cause: picking the tool before evaluating the task. This guide replaces "which one is better" with a five-criteria framework you can run in under five minutes, then walks the same bank reconciliation built two ways so you can see exactly where each one earns its place.

ACA | FMVA® | 19 Years in Finance
The Wrong Question Most Controllers Ask
"Should I use Power Query or formulas" isn't really a technology question. It's a workload-shape question. XLOOKUP and FILTER, covered in our guides on intercompany reconciliation and AR aging, are formula-based tools that recalculate instantly and live inside the cell grid. Power Query is a separate transformation engine, see Microsoft's Power Query documentation for the full technical overview, that runs before formulas ever see the data, and it's built for a different kind of problem entirely: getting messy, high-volume, multi-source data into a clean, structured shape.
Neither tool is "more advanced" than the other. They solve different halves of the same process, and the mistake most reconciliations make is trying to force one tool to do both halves.
Criterion 1: Dataset Volume
Dynamic array formulas recalculate the entire workbook dependency chain every time a cell changes. Below roughly 50,000 rows, this is close to instant on modern hardware. Beyond that, calculation time climbs noticeably, and a reconciliation with several FILTER or XLOOKUP formulas chained together compounds the lag.
Power Query's internal engine is built to handle far larger volumes (into the millions of rows) without the same degradation, because it processes data in a separate query pipeline rather than the live formula-calculation chain.
Use formulas for a single-entity reconciliation under roughly 50,000 rows. Use Power Query for multi-source consolidations, full-year transaction logs, or anything approaching six figures of rows.
Criterion 2: Data Source and Update Frequency
Formula-based reconciliations need their source data to live inside the same workbook, or in another open, linked workbook. Closed-file references are a common source of broken links after a file gets renamed or moved.
Power Query connects directly to external sources: folders of monthly exports, database connections, CSV dumps from an ERP, even web-based data. It's built for a recurring import pattern, not a one-off paste.
Use formulas when your source data is manually entered or pasted into the same workbook each period. Use Power Query when you're pulling from external files or systems on a recurring cadence, exactly the pattern behind our guides on consolidating bank statements automatically and GSTR-2B reconciliation.

Criterion 3: Transformation Complexity
If your reconciliation needs a lookup or a conditional sum against data that's already clean and structured, formulas handle that cleanly. If the raw data needs reshaping first (unpivoting columns, splitting concatenated fields, removing header rows that shift position between exports, merging two differently-structured tables), that's transformation work, and formulas get verbose and fragile trying to do it.
Power Query's step-by-step editor handles exactly this kind of structural cleanup, and every transformation step is recorded and auditable in the Applied Steps pane, rather than buried inside a single dense formula.
Use formulas when source data is already clean and structured. Use Power Query when the raw export needs restructuring before any reconciliation logic can run against it, see our guide on converting a nested AR ageing report for exactly this scenario.
Criterion 4: Calculation Latency Needs
Formulas recalculate the instant a cell changes, genuinely live feedback, which matters for scenario testing or when someone's actively working through a reconciliation and wants to see the impact of a correction immediately.
Power Query requires an explicit refresh, manual, or triggered on file open, rather than continuous recalculation. For most month-end reconciliation processes this isn't a meaningful drawback, since you're refreshing once against a finalised data extract, not continuously editing.
Use formulas when you need instant recalculation during active scenario work. Use Power Query for a periodic, refresh-once-per-cycle reconciliation process.
Criterion 5: Audit Trail Transparency
This is the criterion controllers underweight most often, and it matters for external audit review. A formula sits directly in the cell: click it, and FORMULATEXT or the formula bar shows exactly what it does. An auditor reviewing a formula-based reconciliation can trace logic cell by cell without leaving the worksheet.
Power Query's transformation logic lives in the Power Query Editor, one layer removed from the worksheet grid. It's fully auditable (the Applied Steps pane is arguably a clearer audit trail than a dense nested formula), but it requires the reviewer to open a different window to see it, which some external auditors are less comfortable with.
Use formulas when external auditors specifically expect to see logic directly in the cell grid. Use Power Query when the transformation is complex enough that a formula-based audit trail would be harder to follow than a step-by-step query, not easier.

The Decision Matrix
| Criterion | Favours Formulas | Favours Power Query |
|---|---|---|
| Dataset volume | Under ~50,000 rows | Six figures of rows or multi-source consolidation |
| Data source | Manually entered / pasted in-workbook | External files, folders, or database connections, recurring cadence |
| Transformation need | Data already clean and structured | Raw export needs reshaping before logic can run |
| Calculation latency | Instant recalculation required | Periodic refresh is acceptable |
| Audit trail | Auditor expects logic visible in the cell grid | Complexity makes a step-by-step query clearer than a dense formula |
Most real reconciliations don't land cleanly on one side. Score your specific task against all five, and let the majority decide the primary architecture, then use the other tool for the minority case within the same workbook, which is exactly what the worked example below does.
Worked Example: The Same Bank Reconciliation, Two Ways
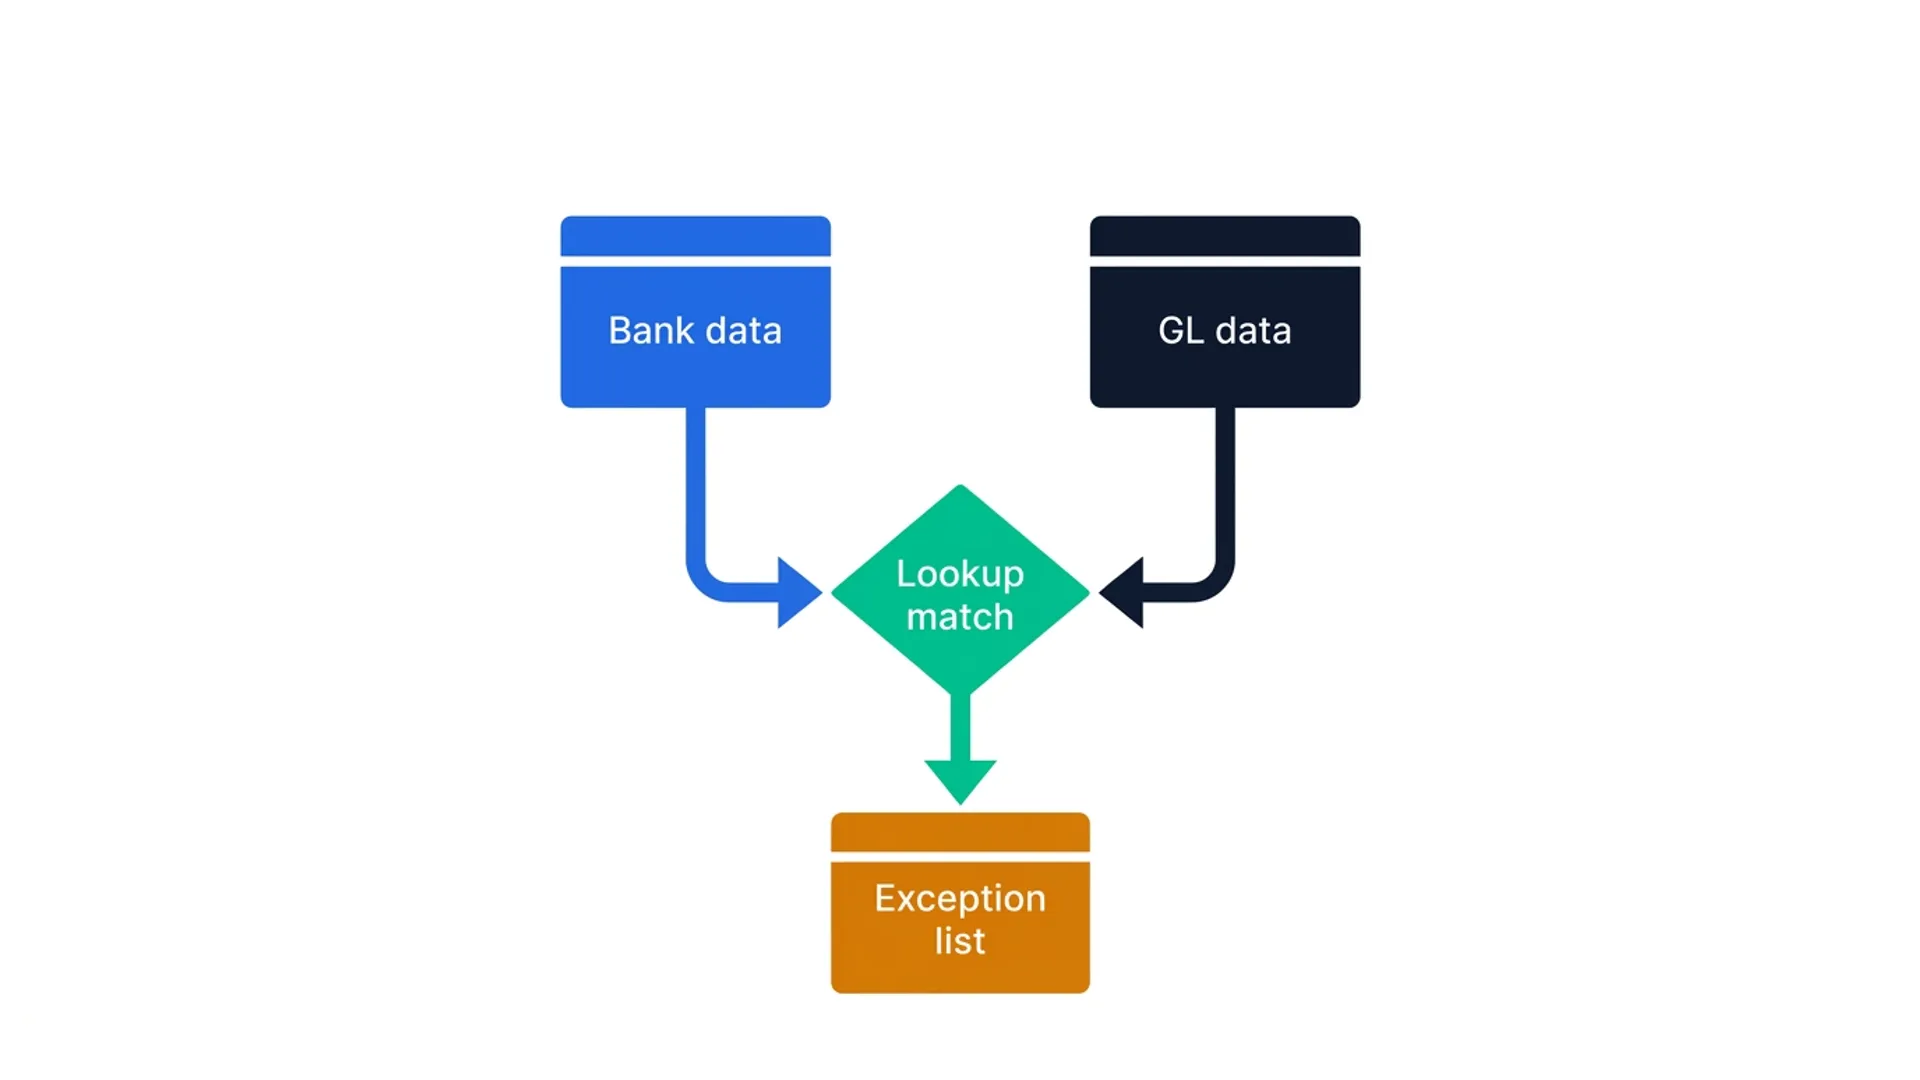
Consider a standard bank reconciliation: matching bank statement lines against general ledger cash postings for one entity, roughly 2,000 transactions a month, sourced from a bank export and the GL extract.
Formula Approach: XLOOKUP and FILTER
For a dataset this size, sourced from two structured tables already inside the workbook, formulas are the right call under nearly every criterion above. A two-way XLOOKUP match (the same shared-key pattern used in our intercompany reconciliation guide) pairs bank lines to GL postings by reference number and amount:
Layer FILTER on top to isolate the exception population:
This gives you a live, self-updating list of unmatched bank lines the moment new data is pasted in: no refresh step, and every formula is visible directly in the cell for audit review.
Power Query Approach: Merge Queries and Fuzzy Matching
Now assume the same reconciliation, but the bank export arrives as a raw CSV with an inconsistent header row position each month, reference numbers that don't always match exactly (a bank system truncating descriptions), and the process needs to run across twelve entity bank accounts, not one.
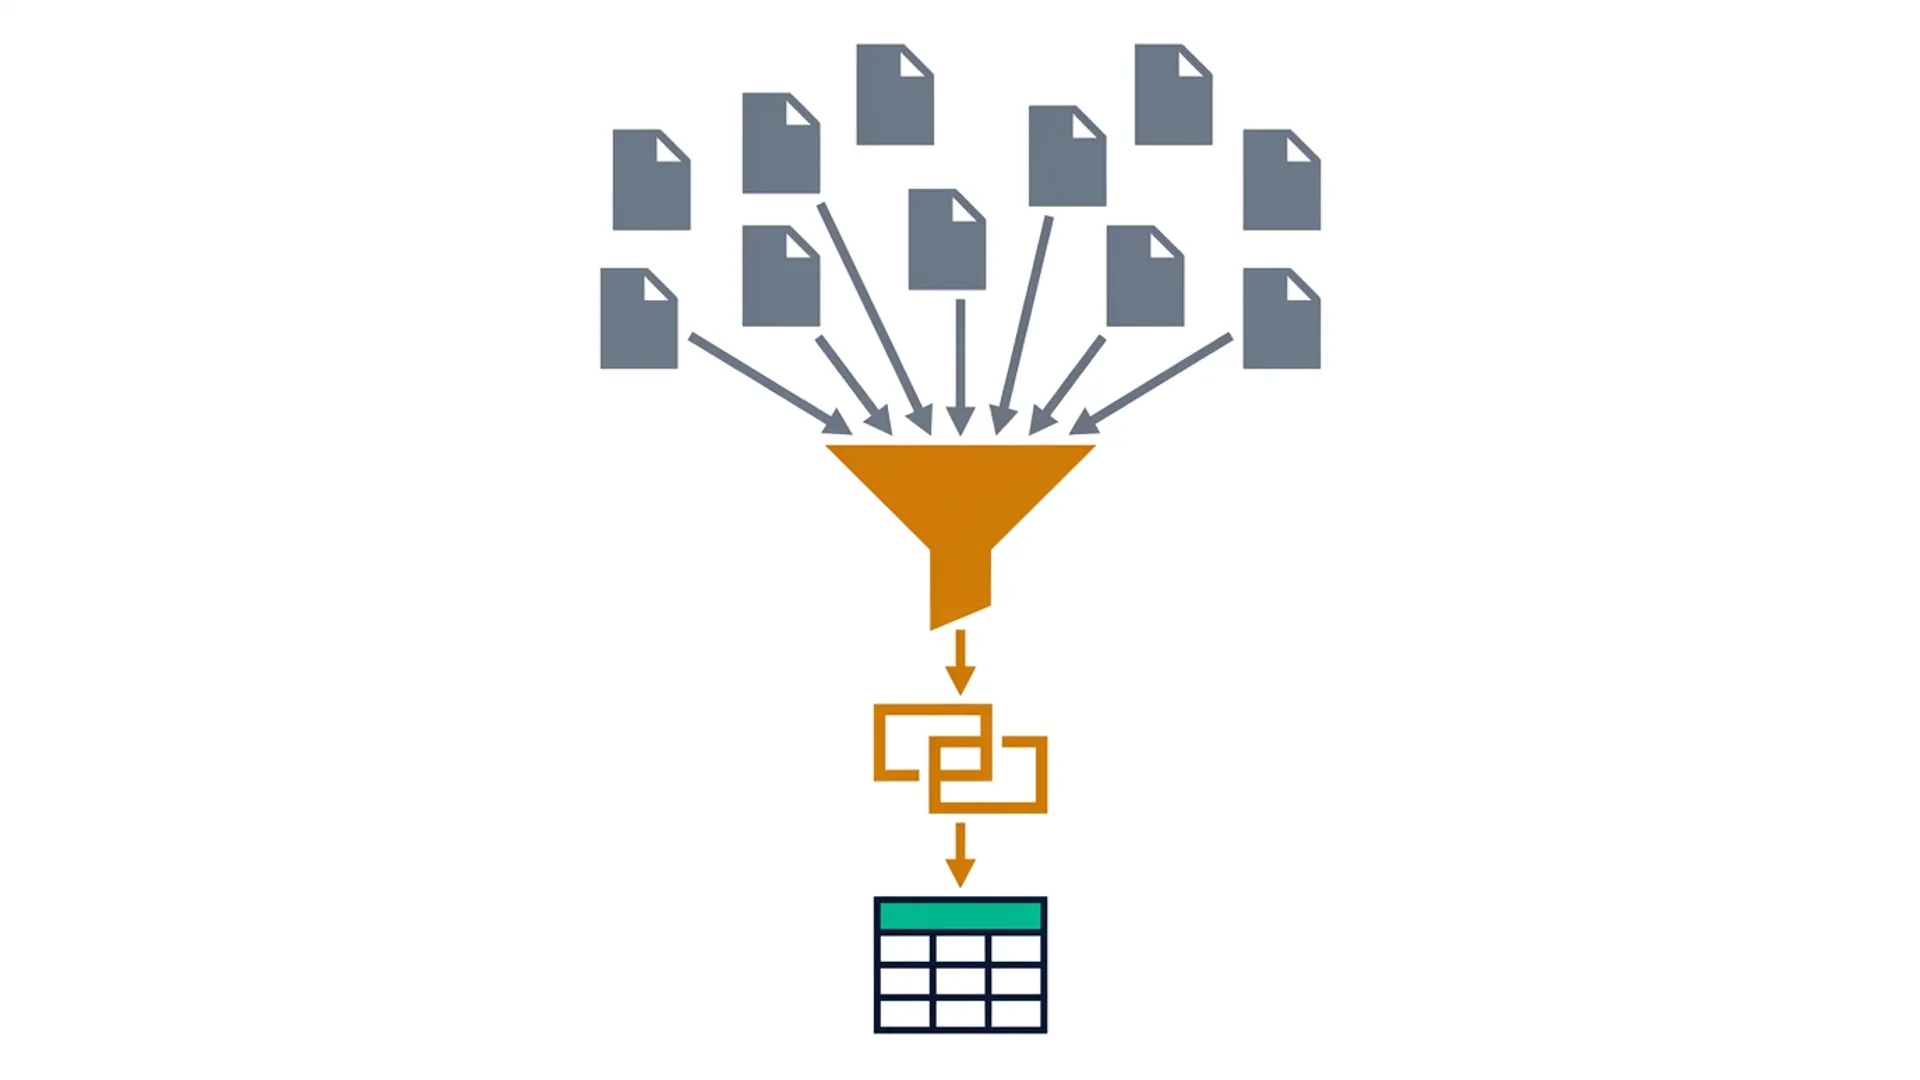
This shifts the criteria decisively toward Power Query. The transformation need alone (cleaning twelve differently-formatted exports into one structured table) would require verbose, fragile formulas to replicate. Power Query's Merge Queries feature, combined with fuzzy matching (which tolerates minor text differences rather than requiring exact matches), handles both the cleanup and the matching in one auditable pipeline: import each entity's export, apply consistent header and type cleanup in the Applied Steps pane, then merge against the GL extract using fuzzy match tolerance on the reference field.
The result refreshes with one click across all twelve entities, rather than twelve separate formula-based worksheets each needing individual maintenance.
Where the Two Approaches Actually Meet
The most robust reconciliation workbooks use both, each doing the half it's built for. Power Query handles the ETL layer, pulling in raw exports, cleaning headers, standardising formats, merging multiple sources into one consistent table. Dynamic array formulas then sit on top of that clean output, doing the live matching, exception flagging, and any scenario-testing logic that benefits from instant recalculation.
This is exactly the architecture behind consolidating bank statements automatically: Power Query does the heavy transformation work, and the reconciliation logic on top stays simple because the data it's working with is already clean.
Version and Deployment Considerations
Power Query has been built into Excel since 2016 (Data tab, Get & Transform Data), so it has broader version compatibility than dynamic array formulas, which require Excel 365 or 2021. If your organisation runs a mix of Excel versions across sites, a Power Query-based reconciliation is more likely to open correctly everywhere than one built on XLOOKUP or FILTER. That's a meaningful practical consideration independent of the five criteria above, particularly for a workbook that gets shared outside your own machine.
Frequently Asked Questions
Is Power Query always better than formulas for large datasets?
Generally yes for pure volume: Power Query's engine handles hundreds of thousands of rows more smoothly than a workbook full of recalculating array formulas. But volume is only one of five criteria. A large dataset that's already clean, sourced from inside the workbook, and needs instant recalculation for scenario testing may still be better served by formulas, or by a hybrid approach.
Can I use Power Query and dynamic array formulas in the same workbook?
Yes, and it's often the strongest architecture. Power Query handles the transformation and consolidation layer (cleaning and merging raw sources) while formulas like XLOOKUP and FILTER sit on top of the clean output for live matching and exception reporting. Neither tool needs to do the whole job alone.
Does Power Query require coding knowledge?
Basic use doesn't. The Power Query Editor's point-and-click interface (filtering, merging, splitting columns, changing types) covers most reconciliation needs without writing any M code directly. More advanced transformations, like custom fuzzy-match logic or conditional column generation, benefit from some M code familiarity, but it's learnable incrementally rather than a prerequisite.
Why does my formula-based reconciliation slow down as it grows?
Dynamic array formulas recalculate their full dependency chain whenever any linked cell changes, and that cost grows with row count. Once a workbook holds several large FILTER or XLOOKUP formulas chained together across tens of thousands of rows, recalculation lag becomes noticeable. This is the clearest volume-based signal that it's time to move the heavy lifting into Power Query.
How do I audit a Power Query transformation for an external auditor?
Open the Power Query Editor and walk through the Applied Steps pane: each transformation step is listed in order, and clicking any step shows the data at that point in the pipeline. This is often a clearer audit trail than a single dense nested formula, though it does require the reviewer to open a separate window rather than reading logic directly off the worksheet grid.
Which approach is better for a bank reconciliation across many entities?
Power Query, in most cases. The transformation work of cleaning and standardising multiple bank export formats before matching is exactly the kind of task its Merge Queries and fuzzy matching features are built for. A single-entity reconciliation with clean, already-structured source data is usually better served by formulas alone.
Conclusion: Choosing the Tool for the Task, Not the Habit
Most controllers default to whichever tool they learned first, then wonder why the workbook strains at scale or why a simple task took three times longer than it should have. The five criteria above (volume, data source, transformation complexity, calculation latency, and audit trail transparency) turn that default into a deliberate choice.
Your action plan:
- 1Score your next reconciliation against all five criteria before opening Excel, not after building it the "usual" way
- 2Default to formulas for clean, in-workbook data under ~50,000 rows where instant recalculation and cell-level audit visibility matter most
- 3Default to Power Query for messy, multi-source, or high-volume data that needs restructuring before any matching logic can run
- 4Consider the hybrid architecture, Power Query for transformation, formulas for the live matching layer on top, for anything that doesn't cleanly favour one side
The goal isn't mastering one tool. It's knowing which one earns its place on any given task, and building workbooks that use both where each genuinely helps.
Want Both Skill Sets, Properly?
Build Advanced Excel Models the Easy Way walks through Power Query, dynamic dashboards, and the full modern Excel toolkit step by step, so you build the right architecture instead of guessing.
Enrol in the CoursePrashant Panchal is a Chartered Accountant (ACA) and Financial Modelling & Valuation Analyst (FMVA®) with 19 years of experience in finance, FP&A, and financial modelling across the GCC region. He is the founder of FinDataPro.
Discussion
Leave a Comment
Comments are moderated and appear once approved.